


Home / What we do / Shipping analytics
Parcel shipping analytics that shows where your money is going
ebb Logic™ is our parcel shipping analytics platform, managed by our team. It brings your UPS, FedEx and LTL freight data together so you can understand your shipping costs, spot billing problems and find ways to save. We explain the findings and help you decide which changes make sense for your business.
What is parcel shipping analytics software?
Parcel shipping analytics software brings carrier invoice and shipment data together to show what you spend and how deliveries perform. It tracks costs, surcharges, package weights, shipping zones and service use across carriers such as UPS and FedEx. This helps you compare carriers, identify unnecessary charges and find ways to lower shipping costs.
Our team and your team use the same portal. It combines carrier invoices and TMS exports to show costs, packaging, services, destinations and freight. Savings estimates compare similar shipments from your own history, with the supporting packages available to review.
Compare shipping costs across carriers.
UPS, FedEx and freight brokers report billing data in different formats. Combining those records helps finance and operations see the same cost-per-package figures, recurring address corrections and packages billed by dimensional weight.
Our shipping analytics software identifies possible changes, estimates their value and shows the data behind each calculation. If the records do not support an estimate, the portal says so.
Use billing data to decide what to change.
What you see when you log in.
Multi-carrier shipping analytics
Every carrier and mode in one view
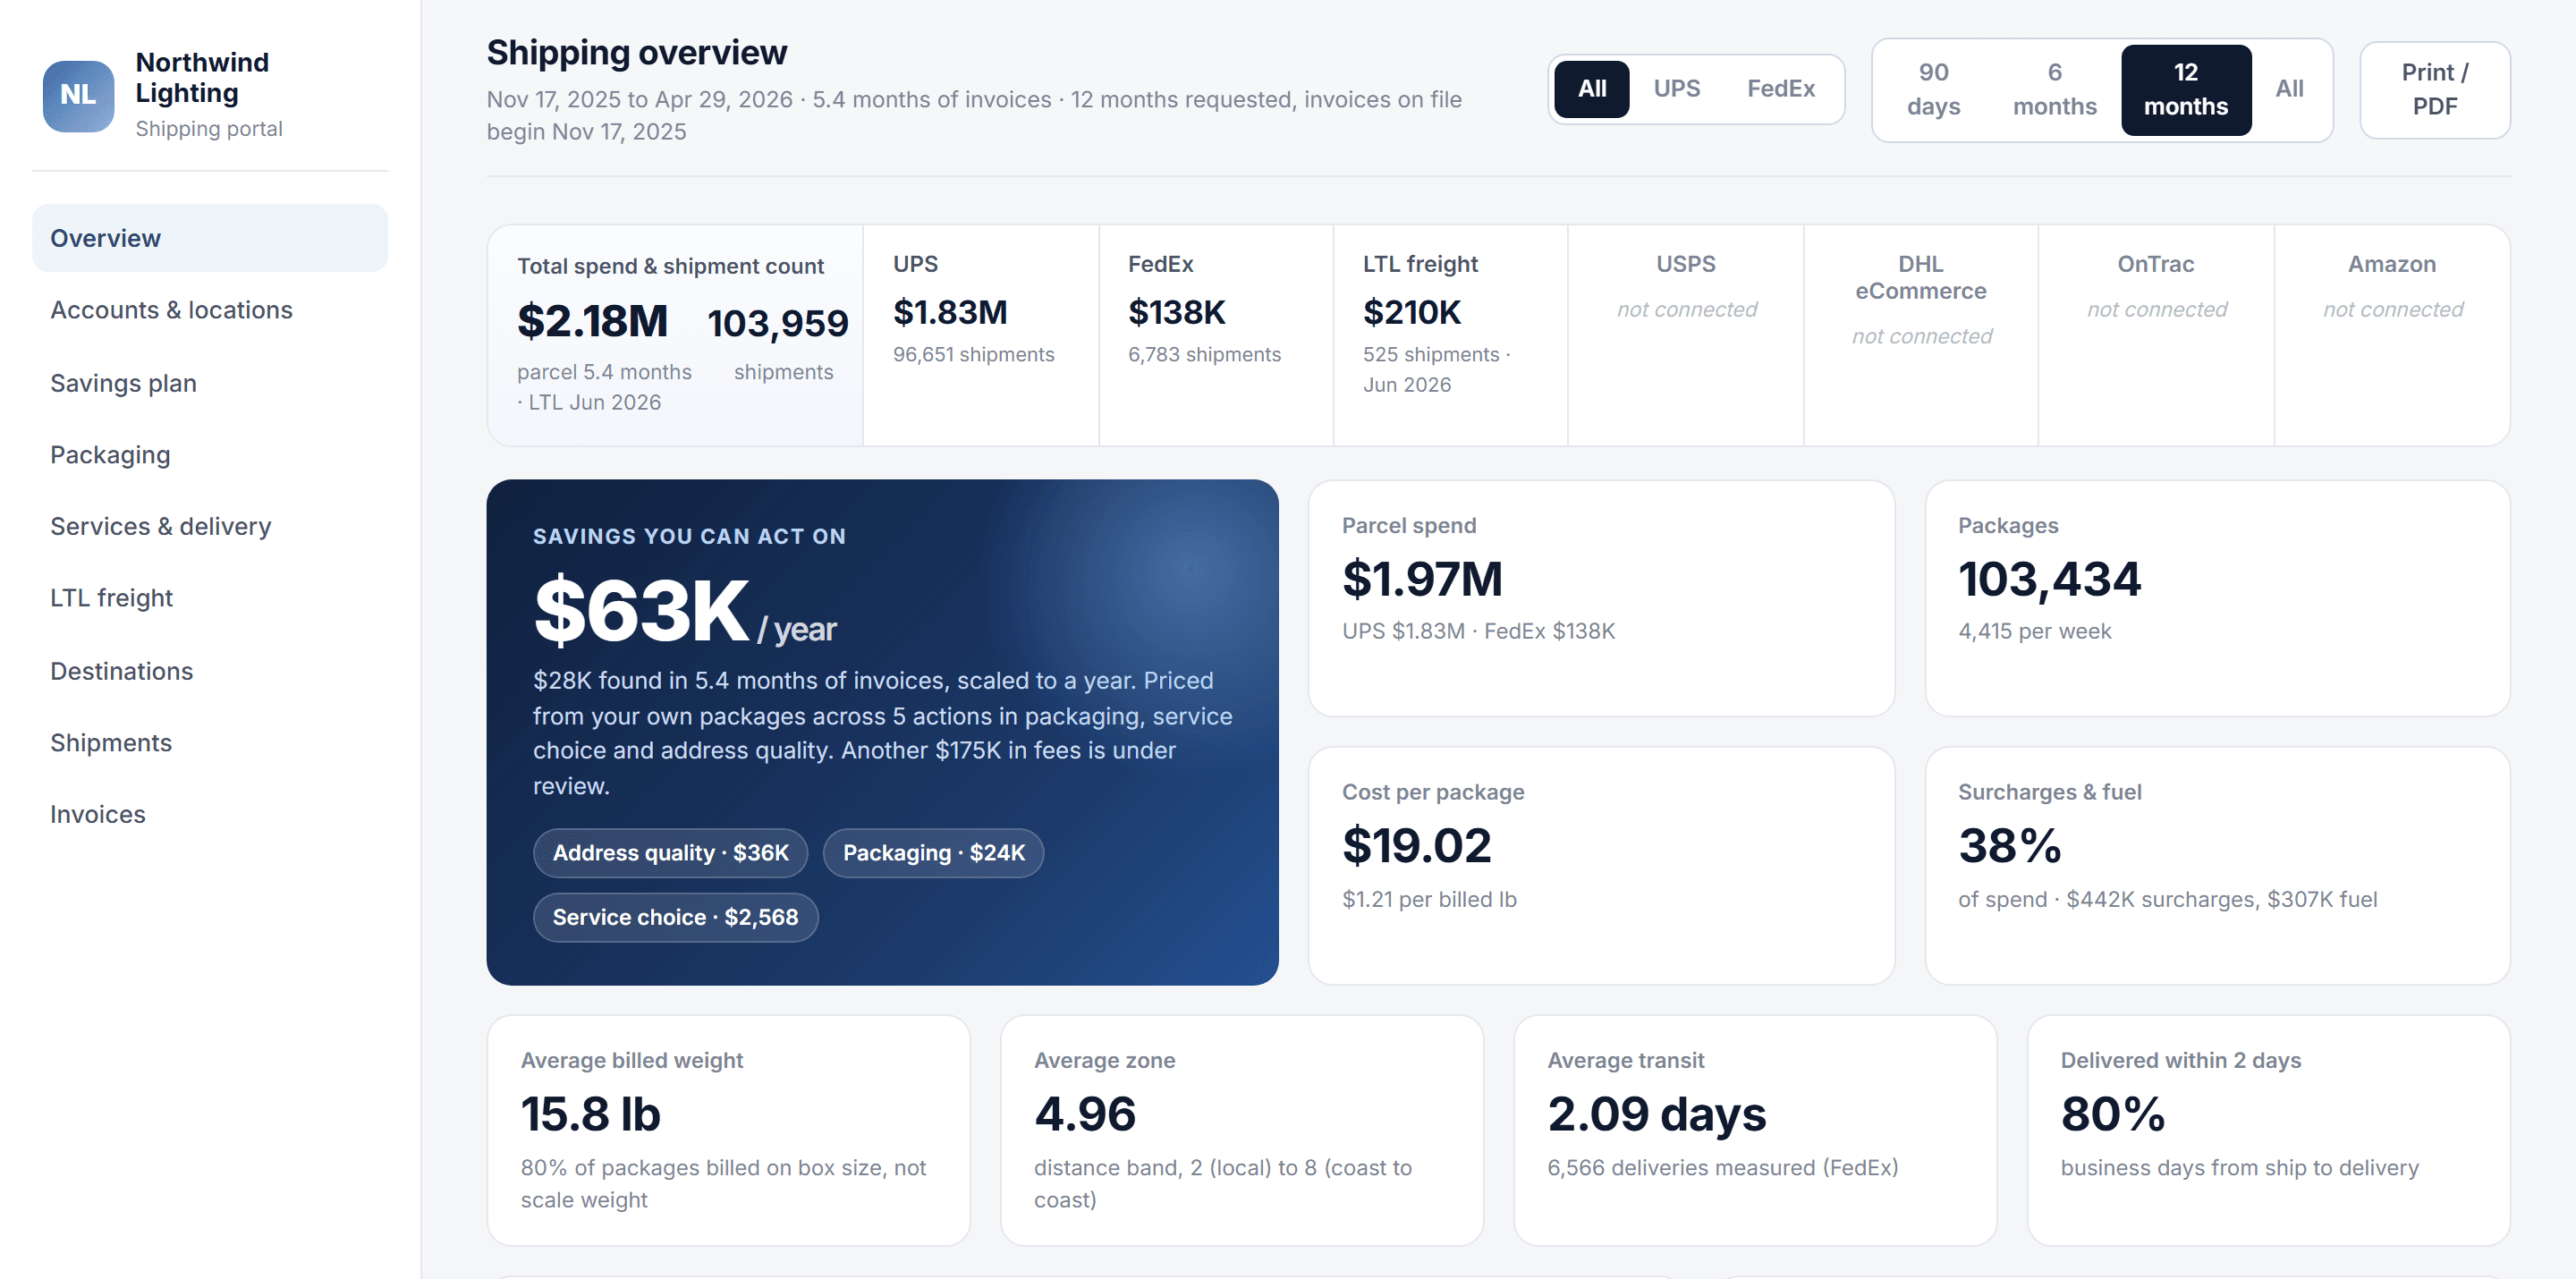
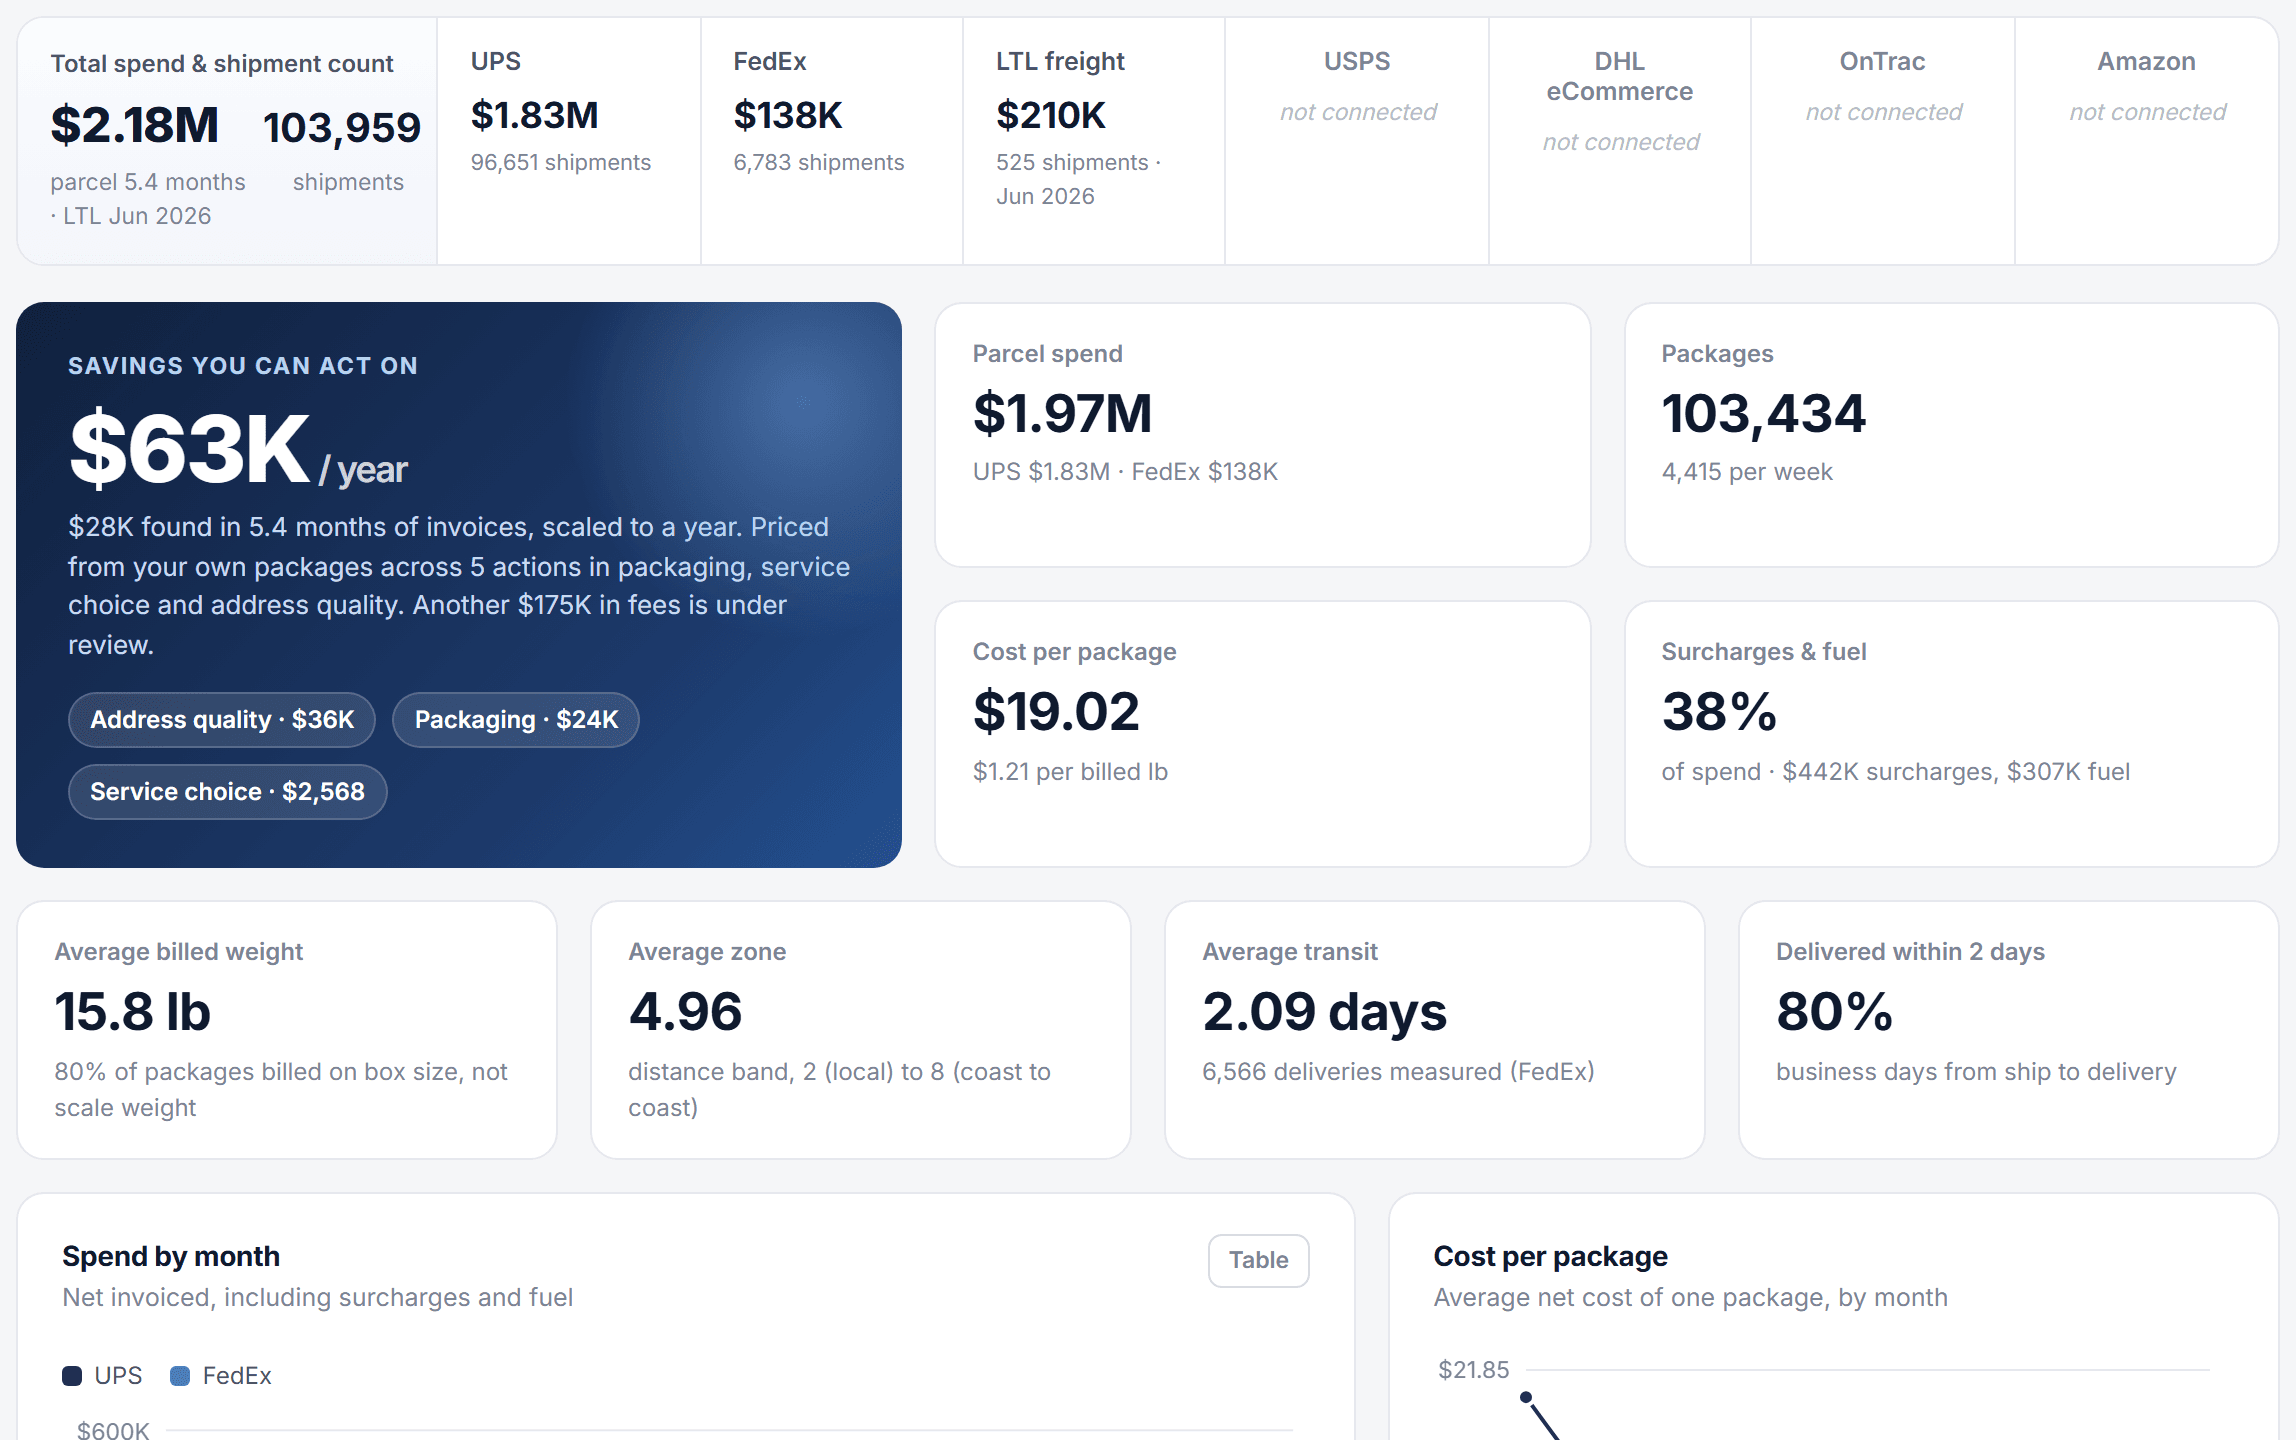
ebb Logic™ brings parcel and LTL freight data together so you can compare shipping costs and delivery performance across carriers. See your accounts, services, shipment details and surcharges in one place.
- Spend and shipment count by carrier, with LTL freight beside parcel
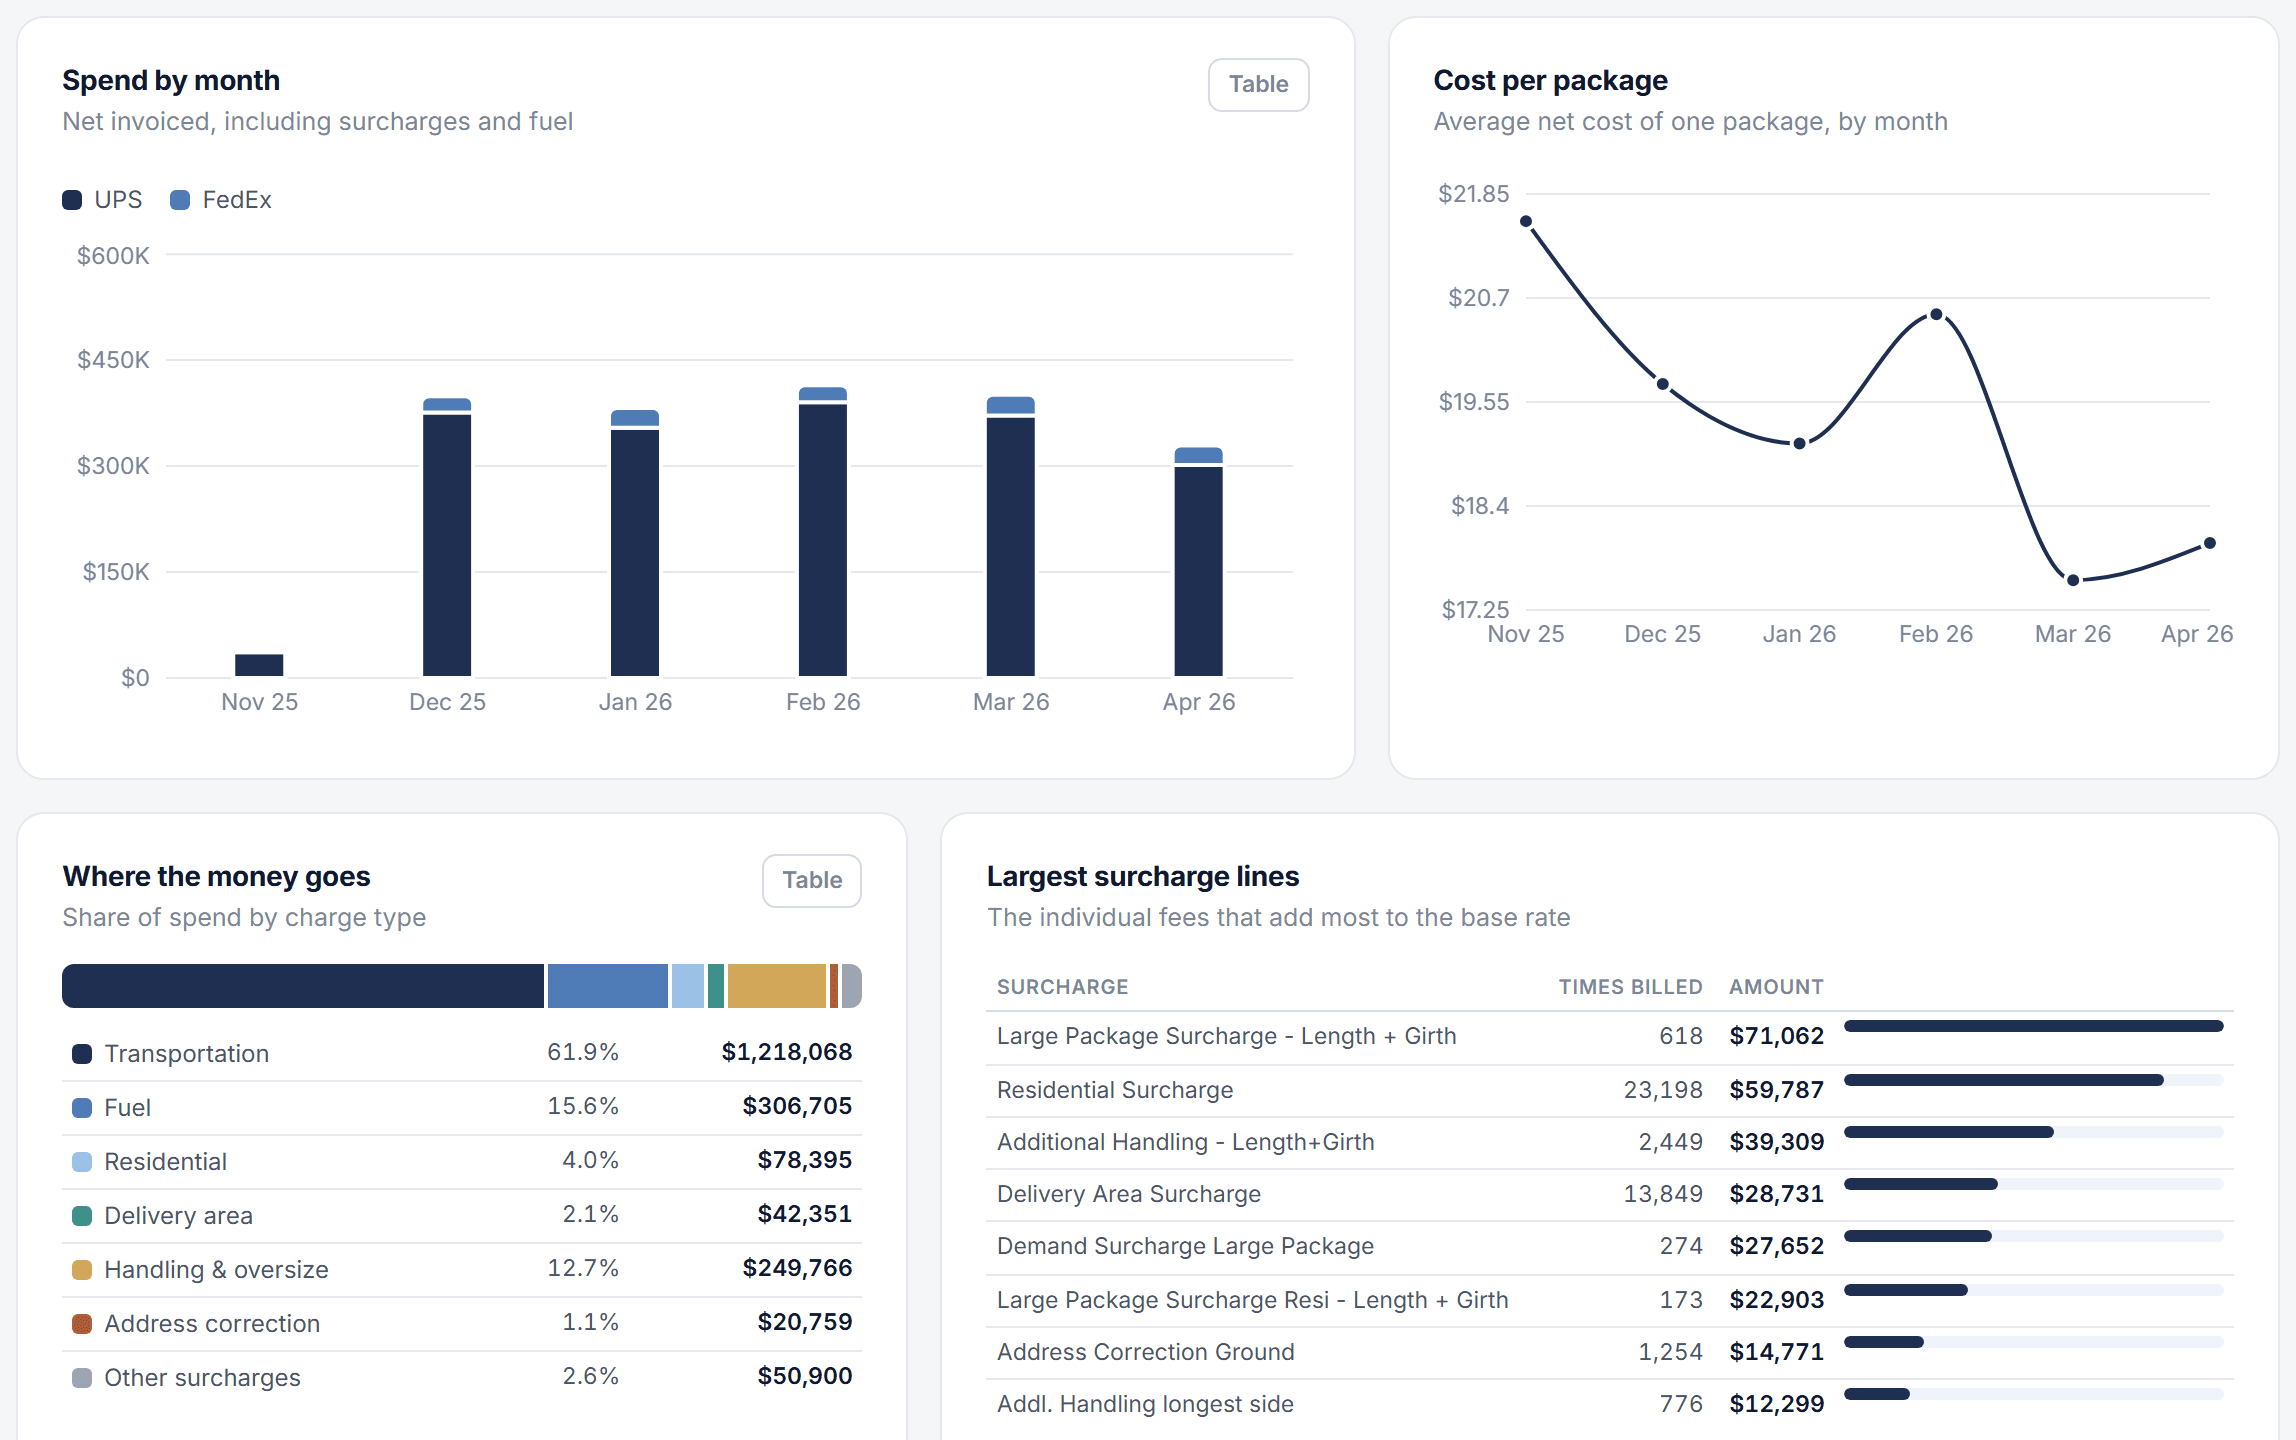
- Spend by month stacked by carrier, and cost per package on its own axis
- Date ranges based on the invoices available
Shipping cost analytics
Where the money goes, line by line
See transportation, fuel, residential, delivery area, handling, oversize and address correction charges in dollars and as a share of spend. Review the largest surcharge totals and how often each fee was billed.
- Charge breakdowns shown as charts and tables
- Largest surcharge lines with times billed and amount
- Average cost per shipment and per billed pound, with prior-period change when the data covers it
Parcel cost savings
A savings plan priced from your own shipments
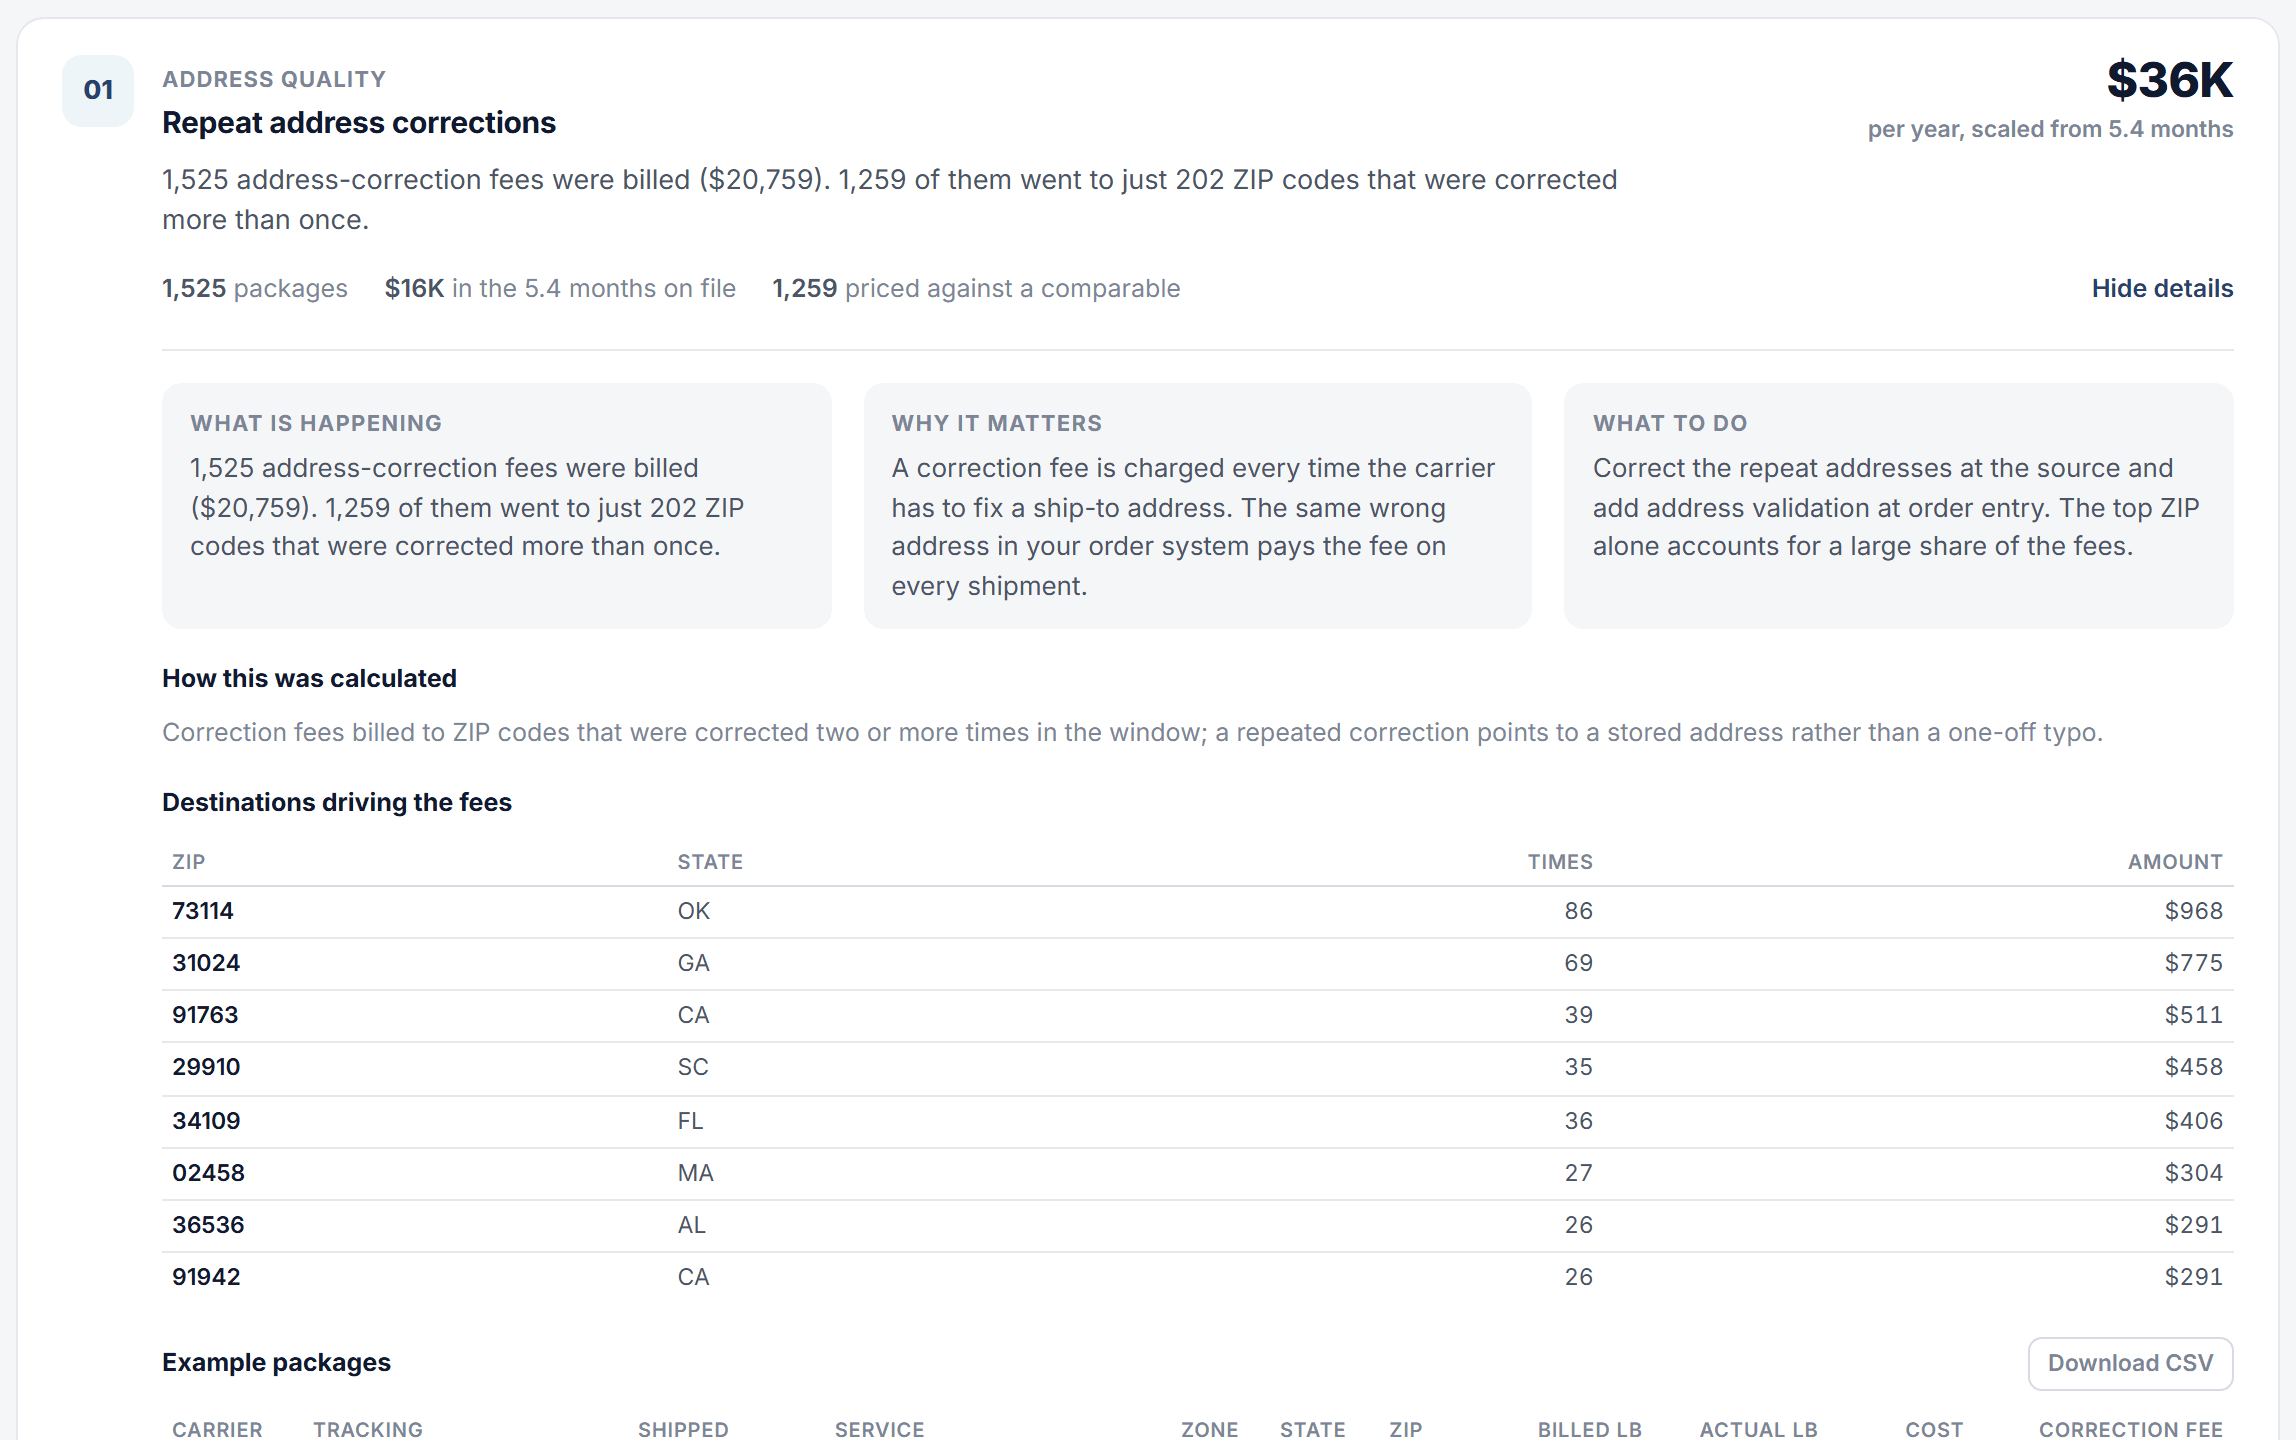
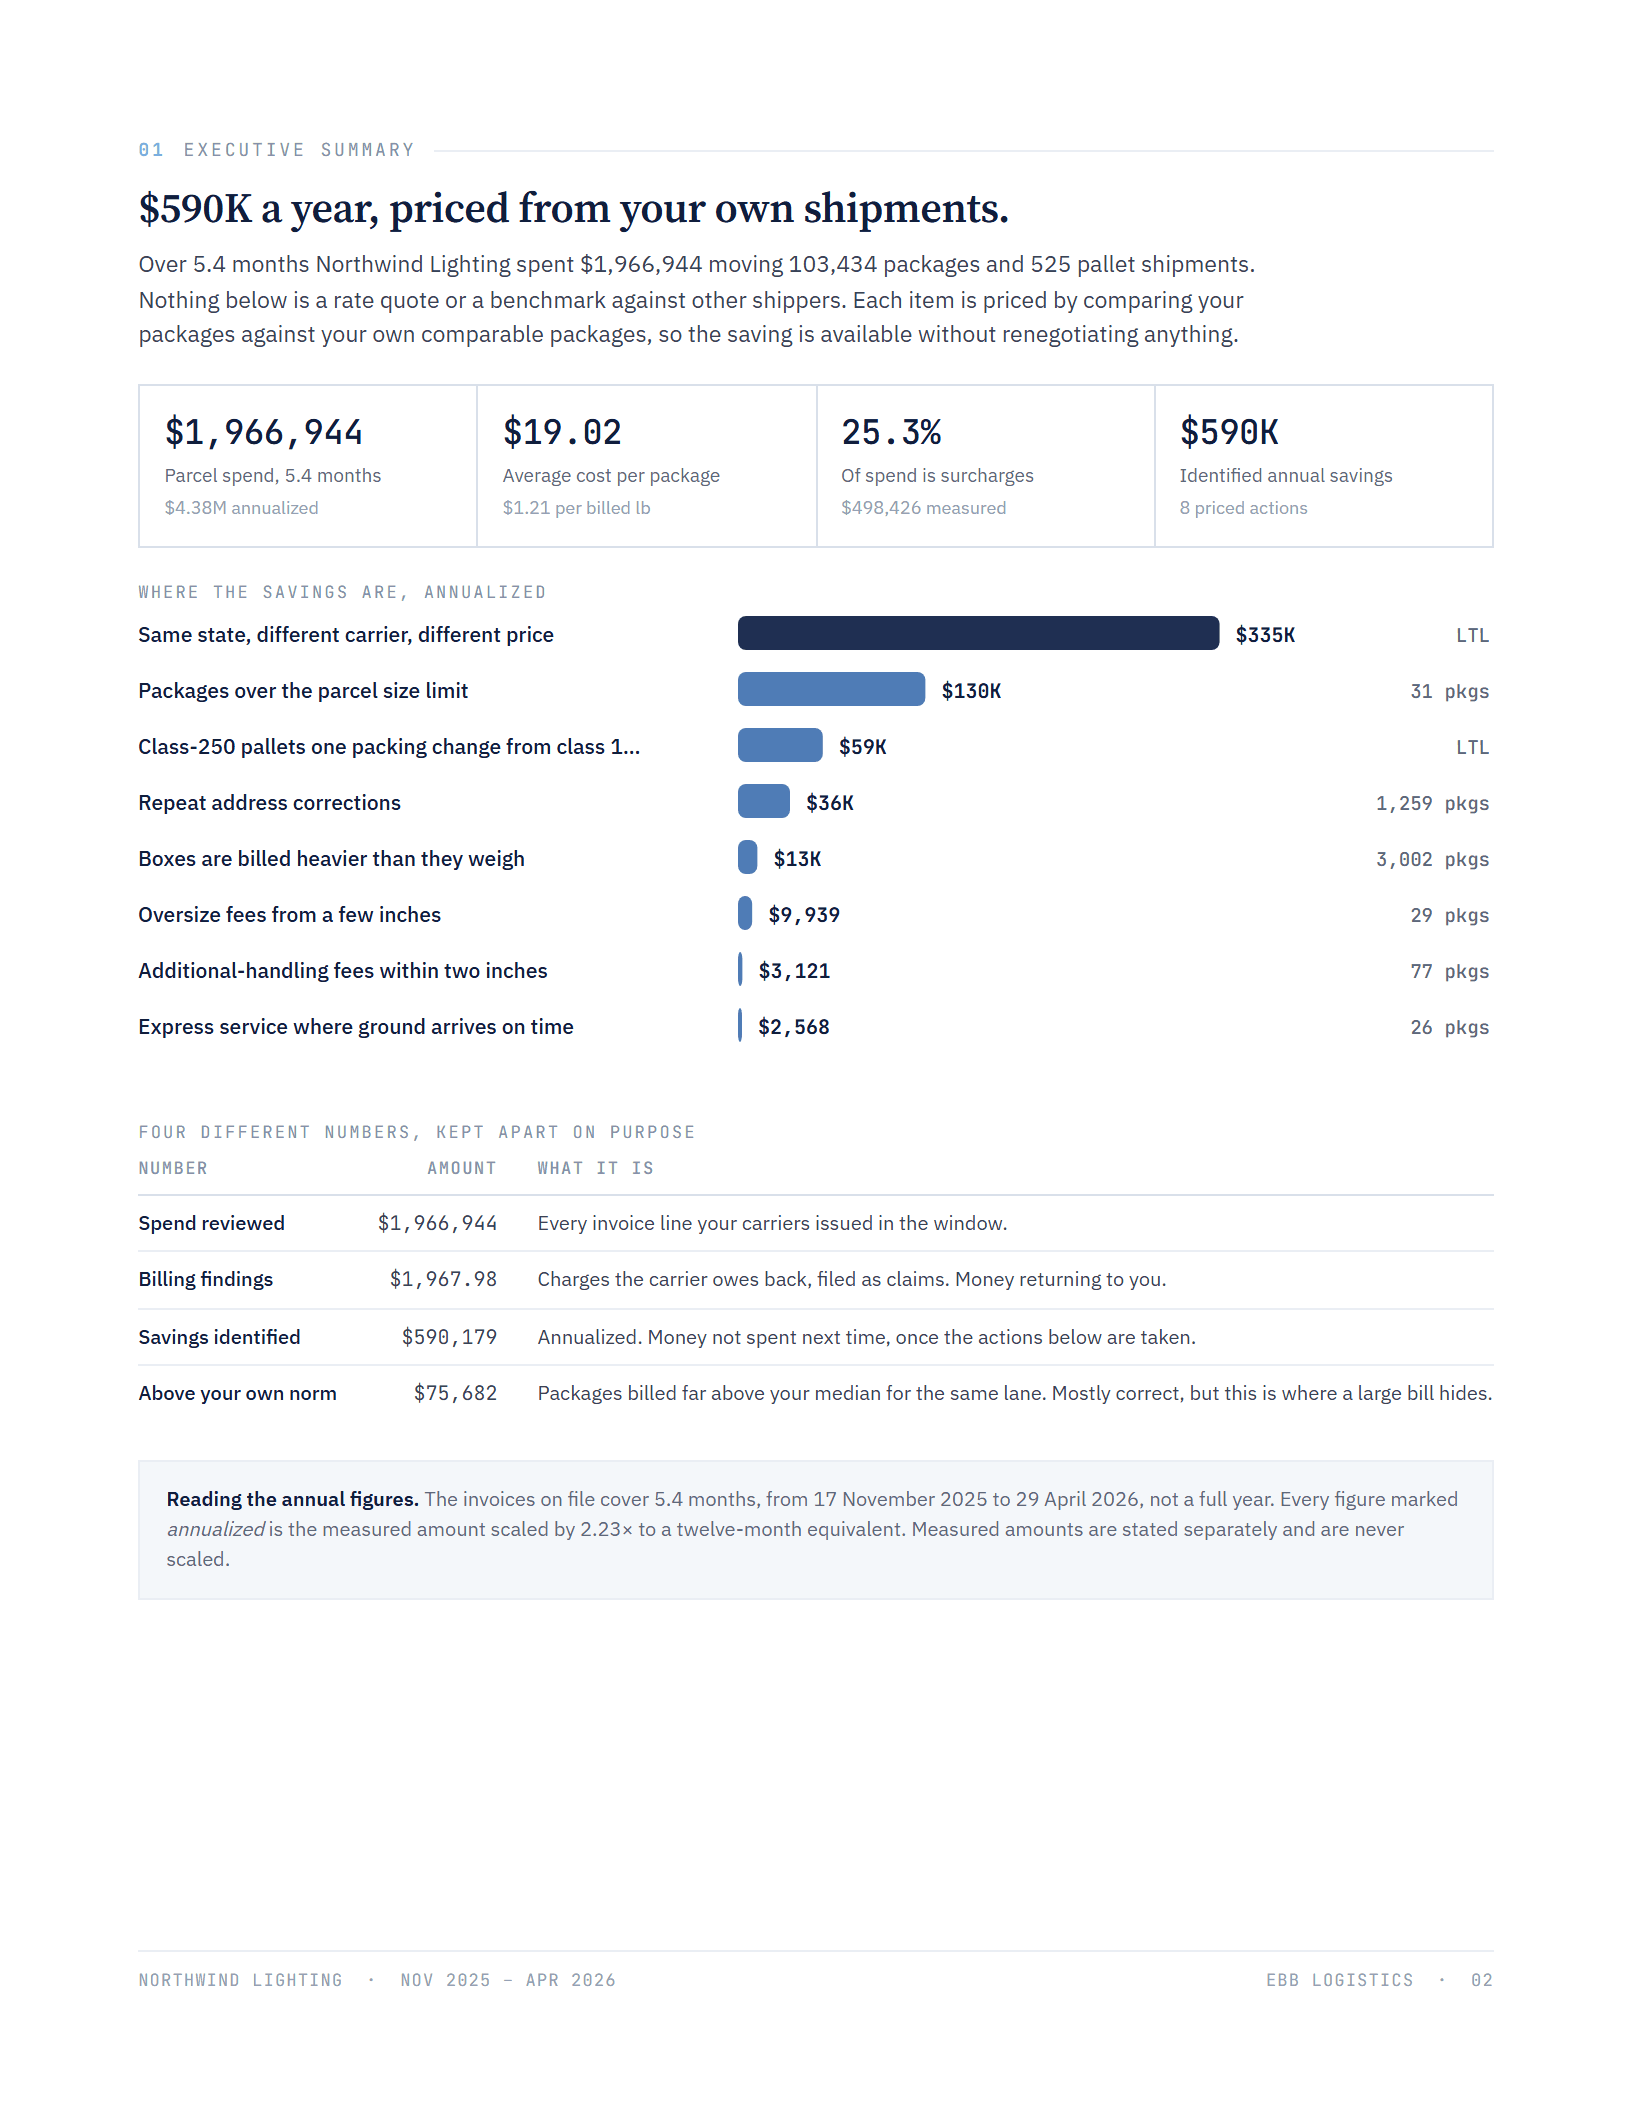
Savings recommendations are ranked by estimated annual value. Calculations compare your packages with similar shipments on the same carrier, service, zone and weight. Open a finding to see the recommended action, calculation and example shipments.
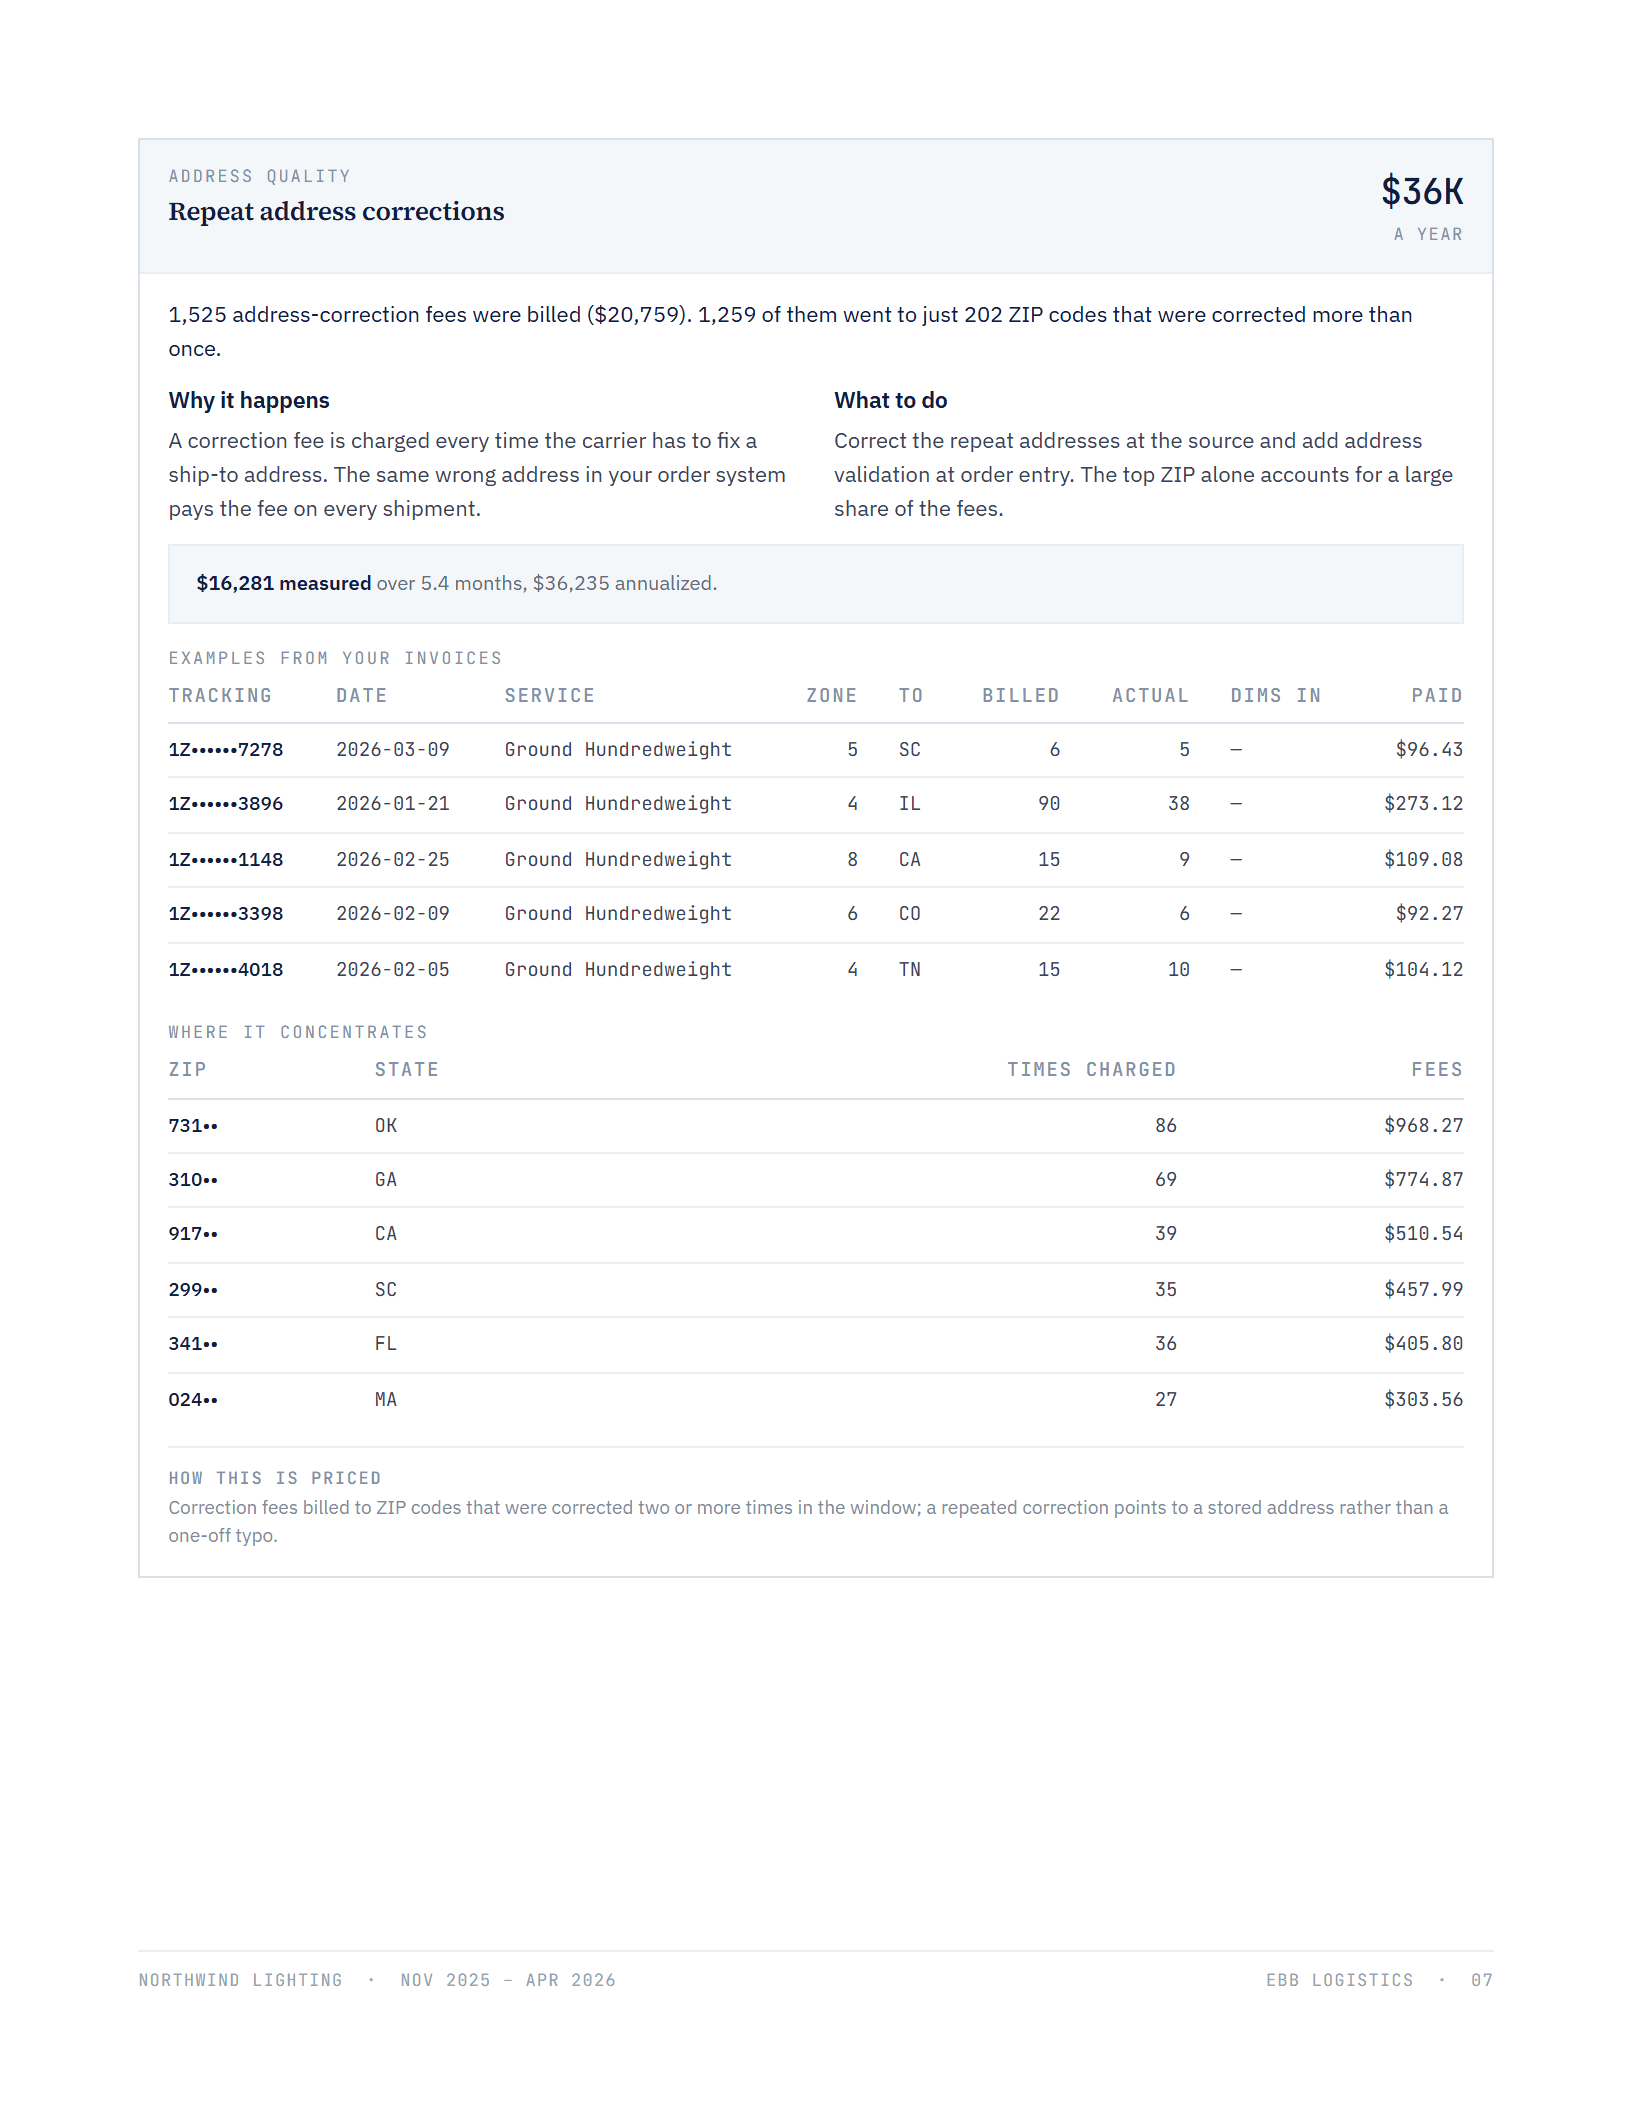
- Repeat address corrections traced to the ZIP codes that keep triggering them
- Oversize and additional-handling fees within inches of a threshold
- Express service on lanes where your own ground arrived in the same time
- Opportunities needing a business decision are labeled separately from calculated savings
Dimensional weight analysis
Packaging, measured against the bill
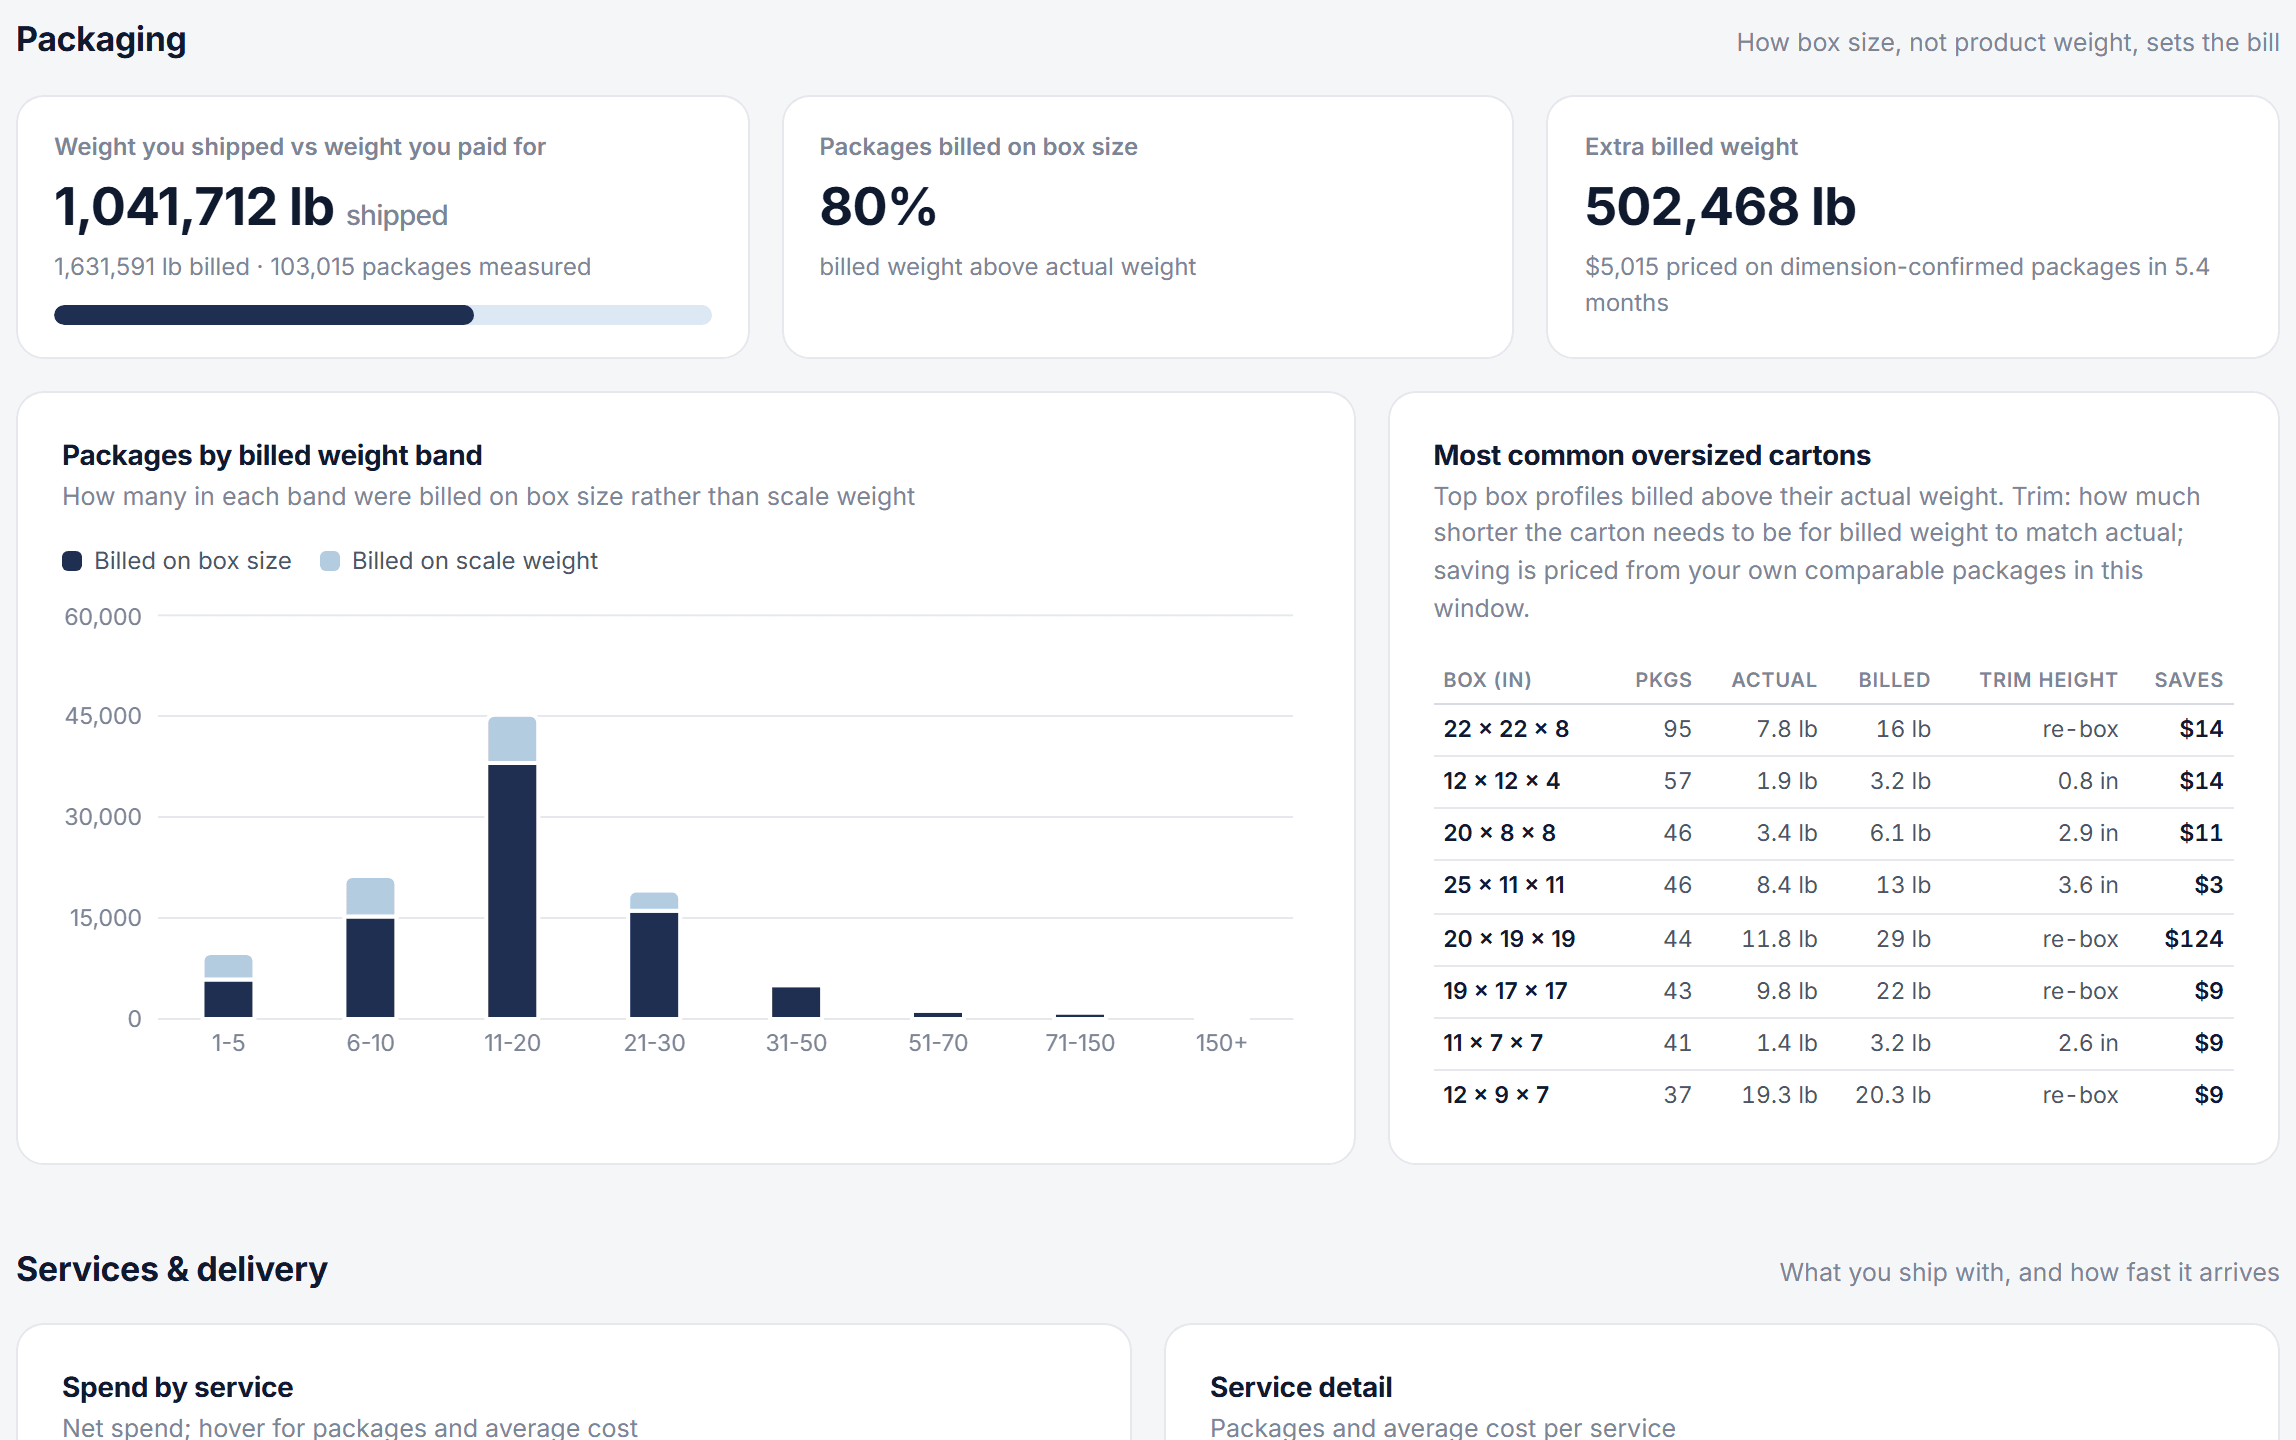
Compare actual and billed weight to see where package size increases your shipping costs. Use the findings to evaluate different package sizes and identify changes that could reduce dimensional weight and shipping charges.
- Billed versus actual weight by weight band
- Package sizes that contribute most to dimensional weight charges
- Savings estimates based on shipments with confirmed dimensions
Carrier performance analytics
Service mix and time in transit
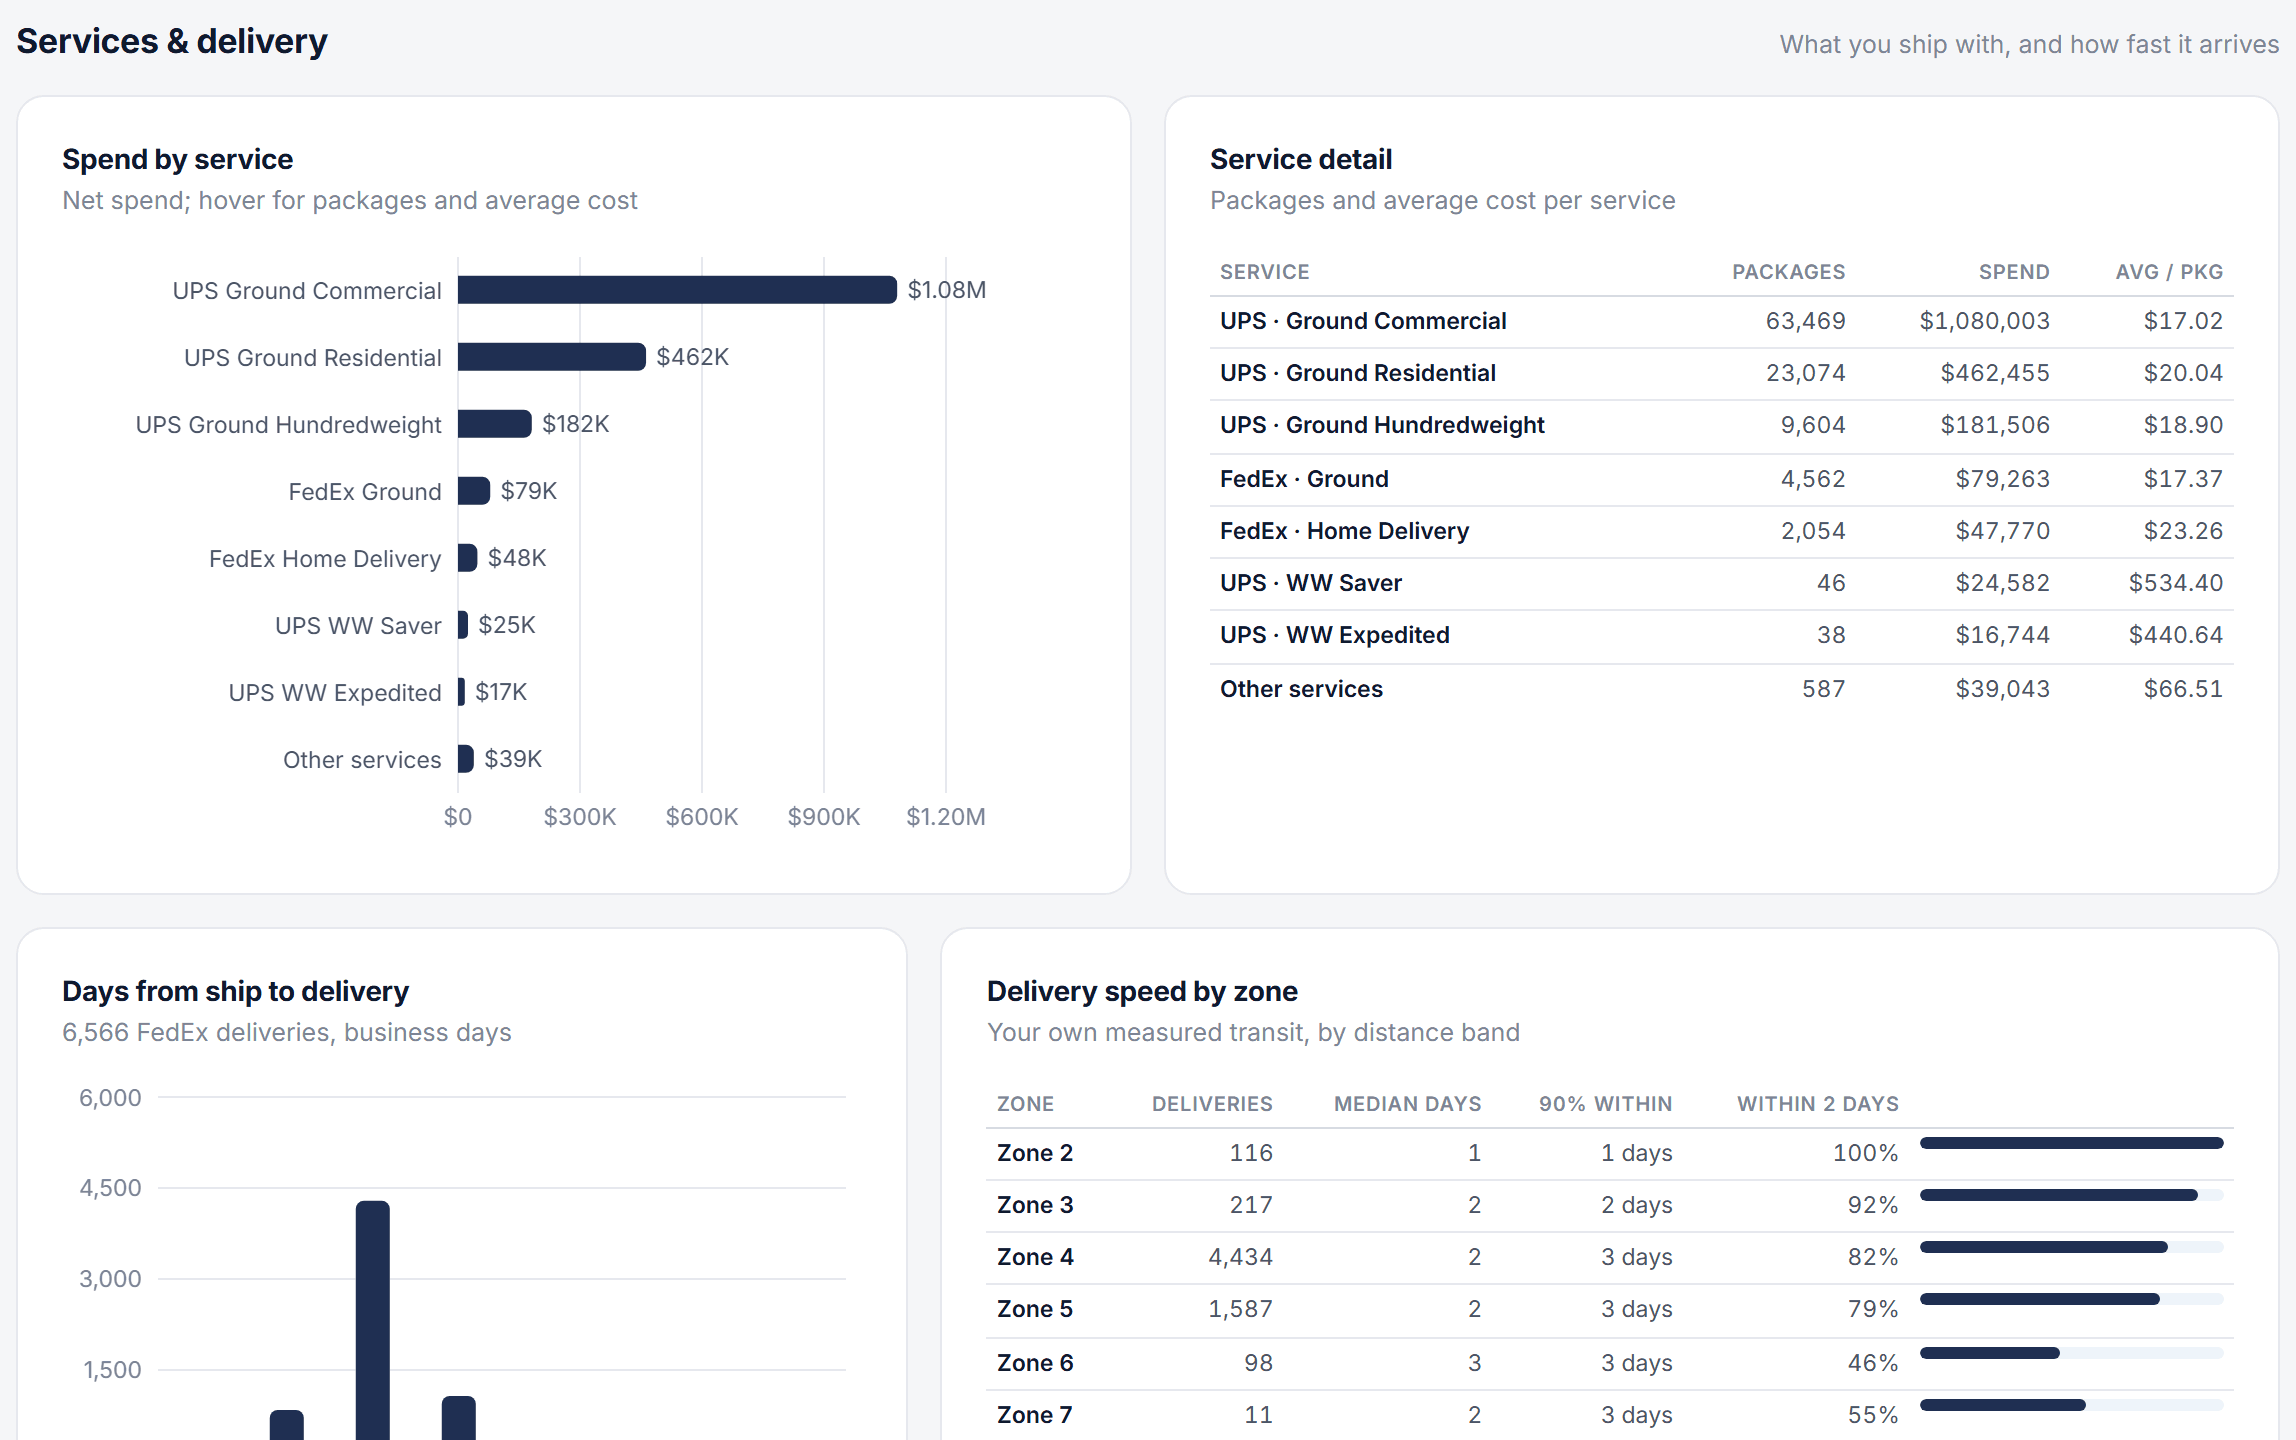
Review spend and volume by service, then compare actual delivery times from shipment and proof-of-delivery dates. Transit times by zone help you assess where ground could meet the same deadline as express.
- Spend by service with packages and average cost on hover
- Transit histogram and median, ninetieth percentile and two-day share by zone
- Per-service transit so an overnight product that arrives in two days is visible
Multi-location shipping reporting
From the corporate total down to each billing account
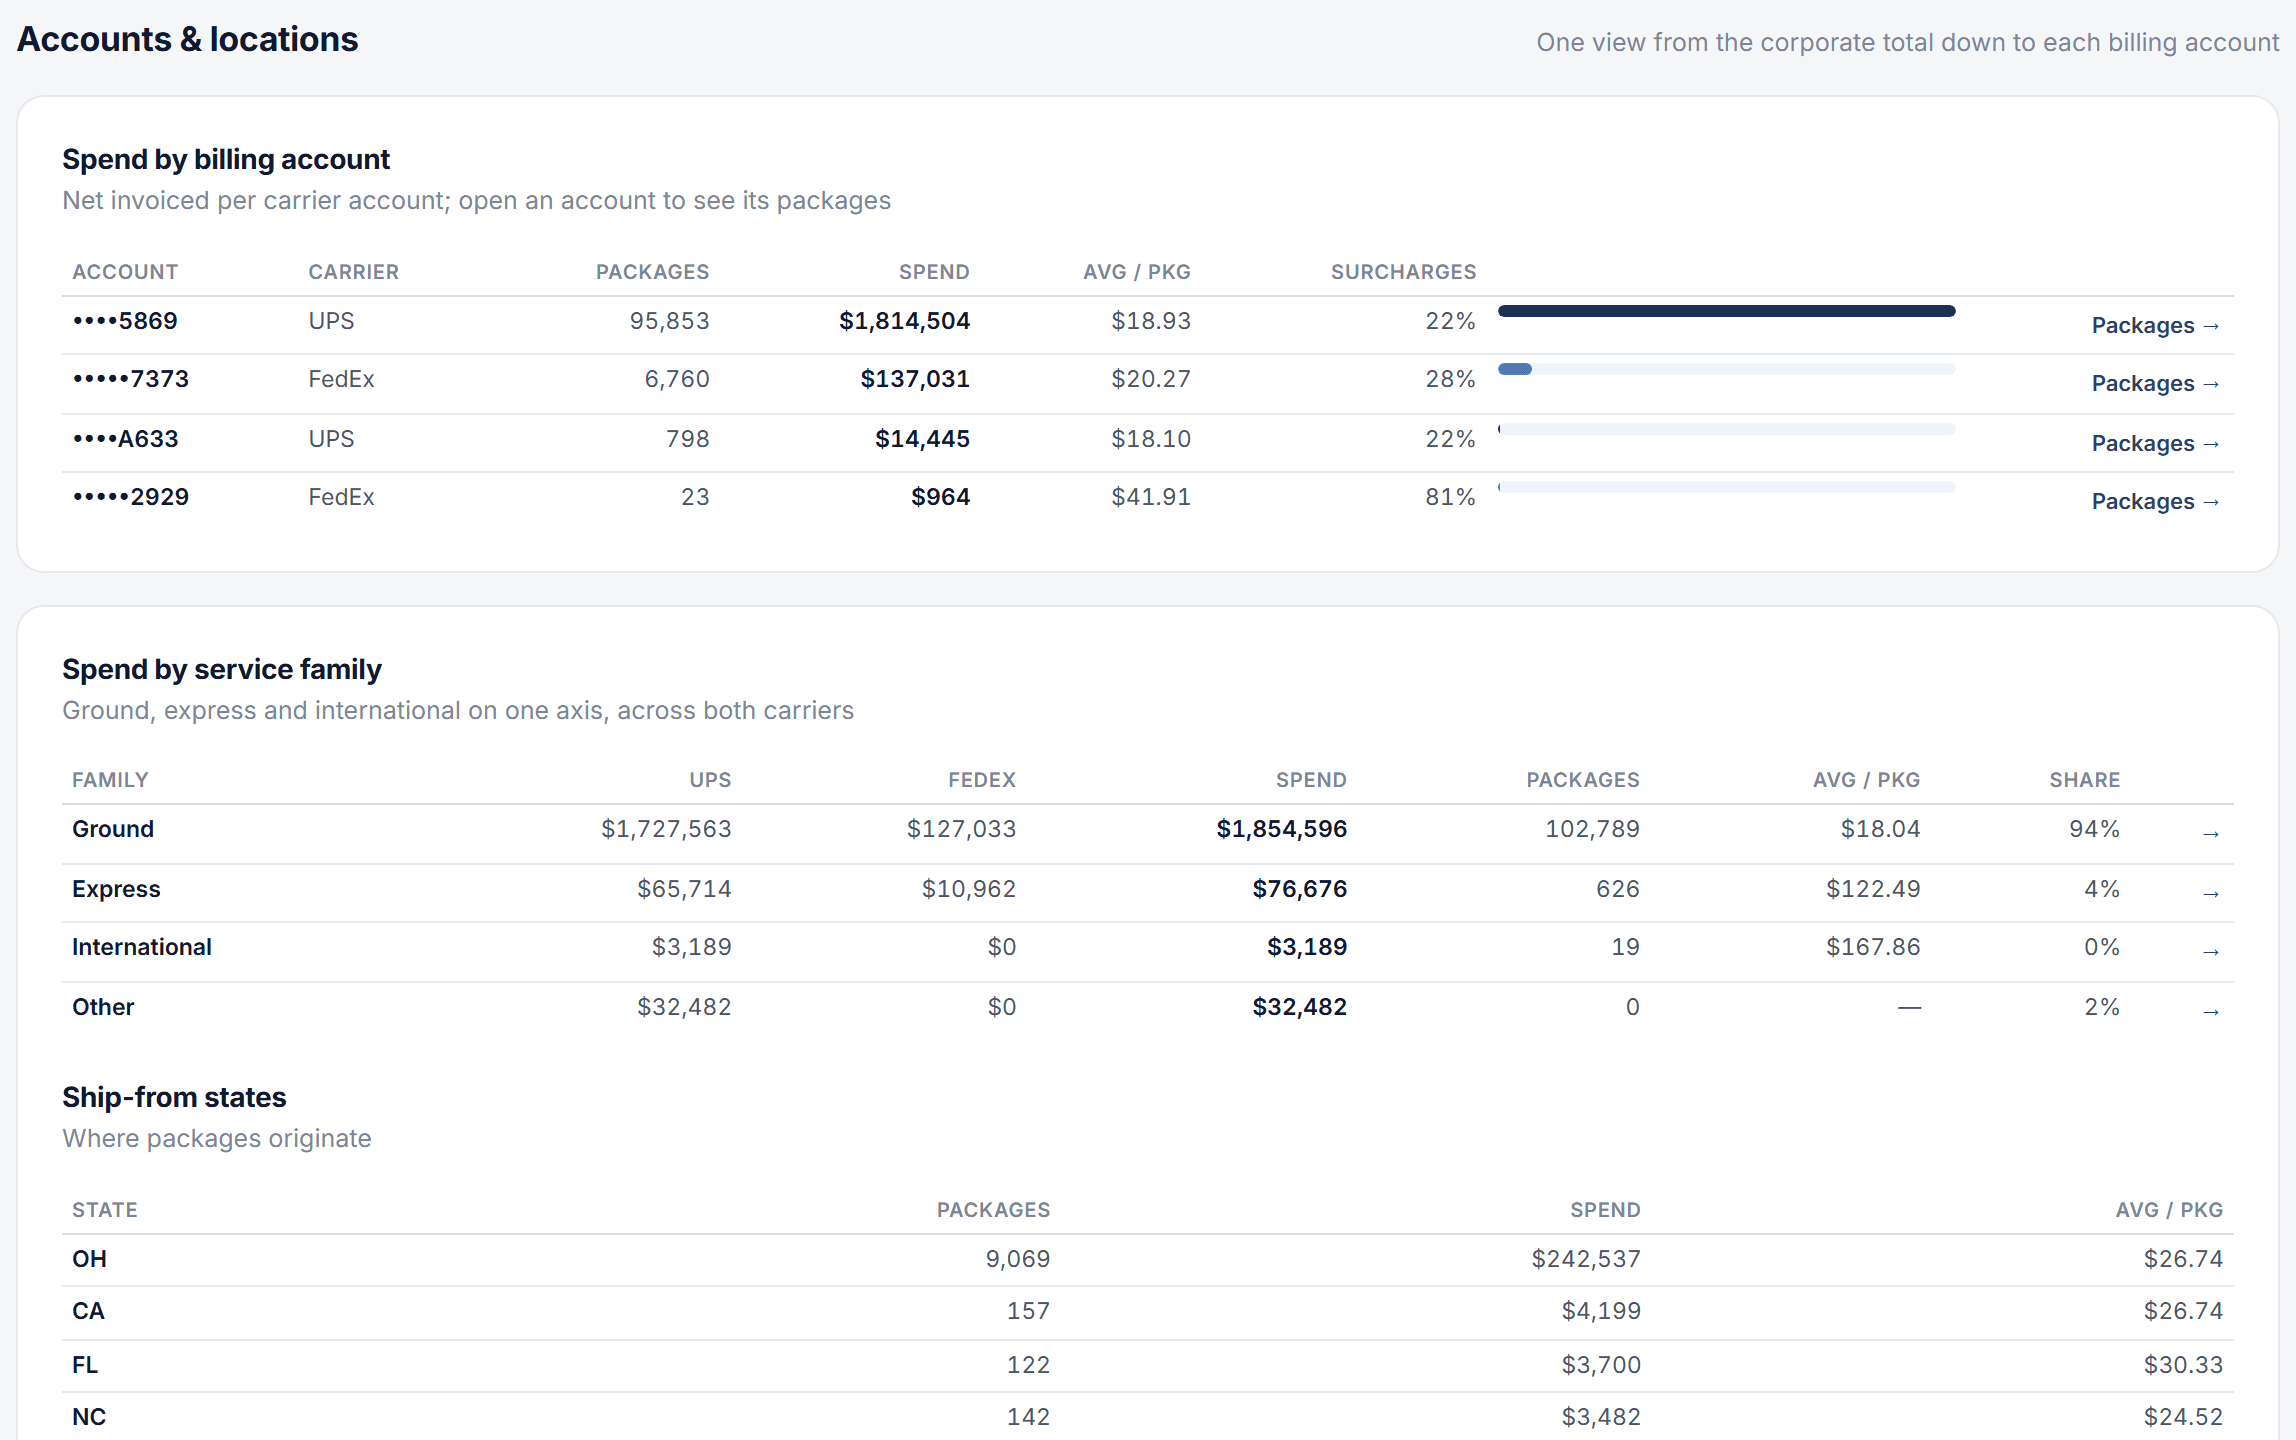
See spend, shipment count, average cost and surcharge share for each carrier account. Open a row to review its packages. Compare ground, express and international services across carriers and see where shipments originate.
- Spend by billing account with surcharge share and drill-through
- Service family roll-up across UPS and FedEx
- Zone by weight cost map and a package-level shipment explorer
Parcel zone analysis
Where packages go, and what distance costs
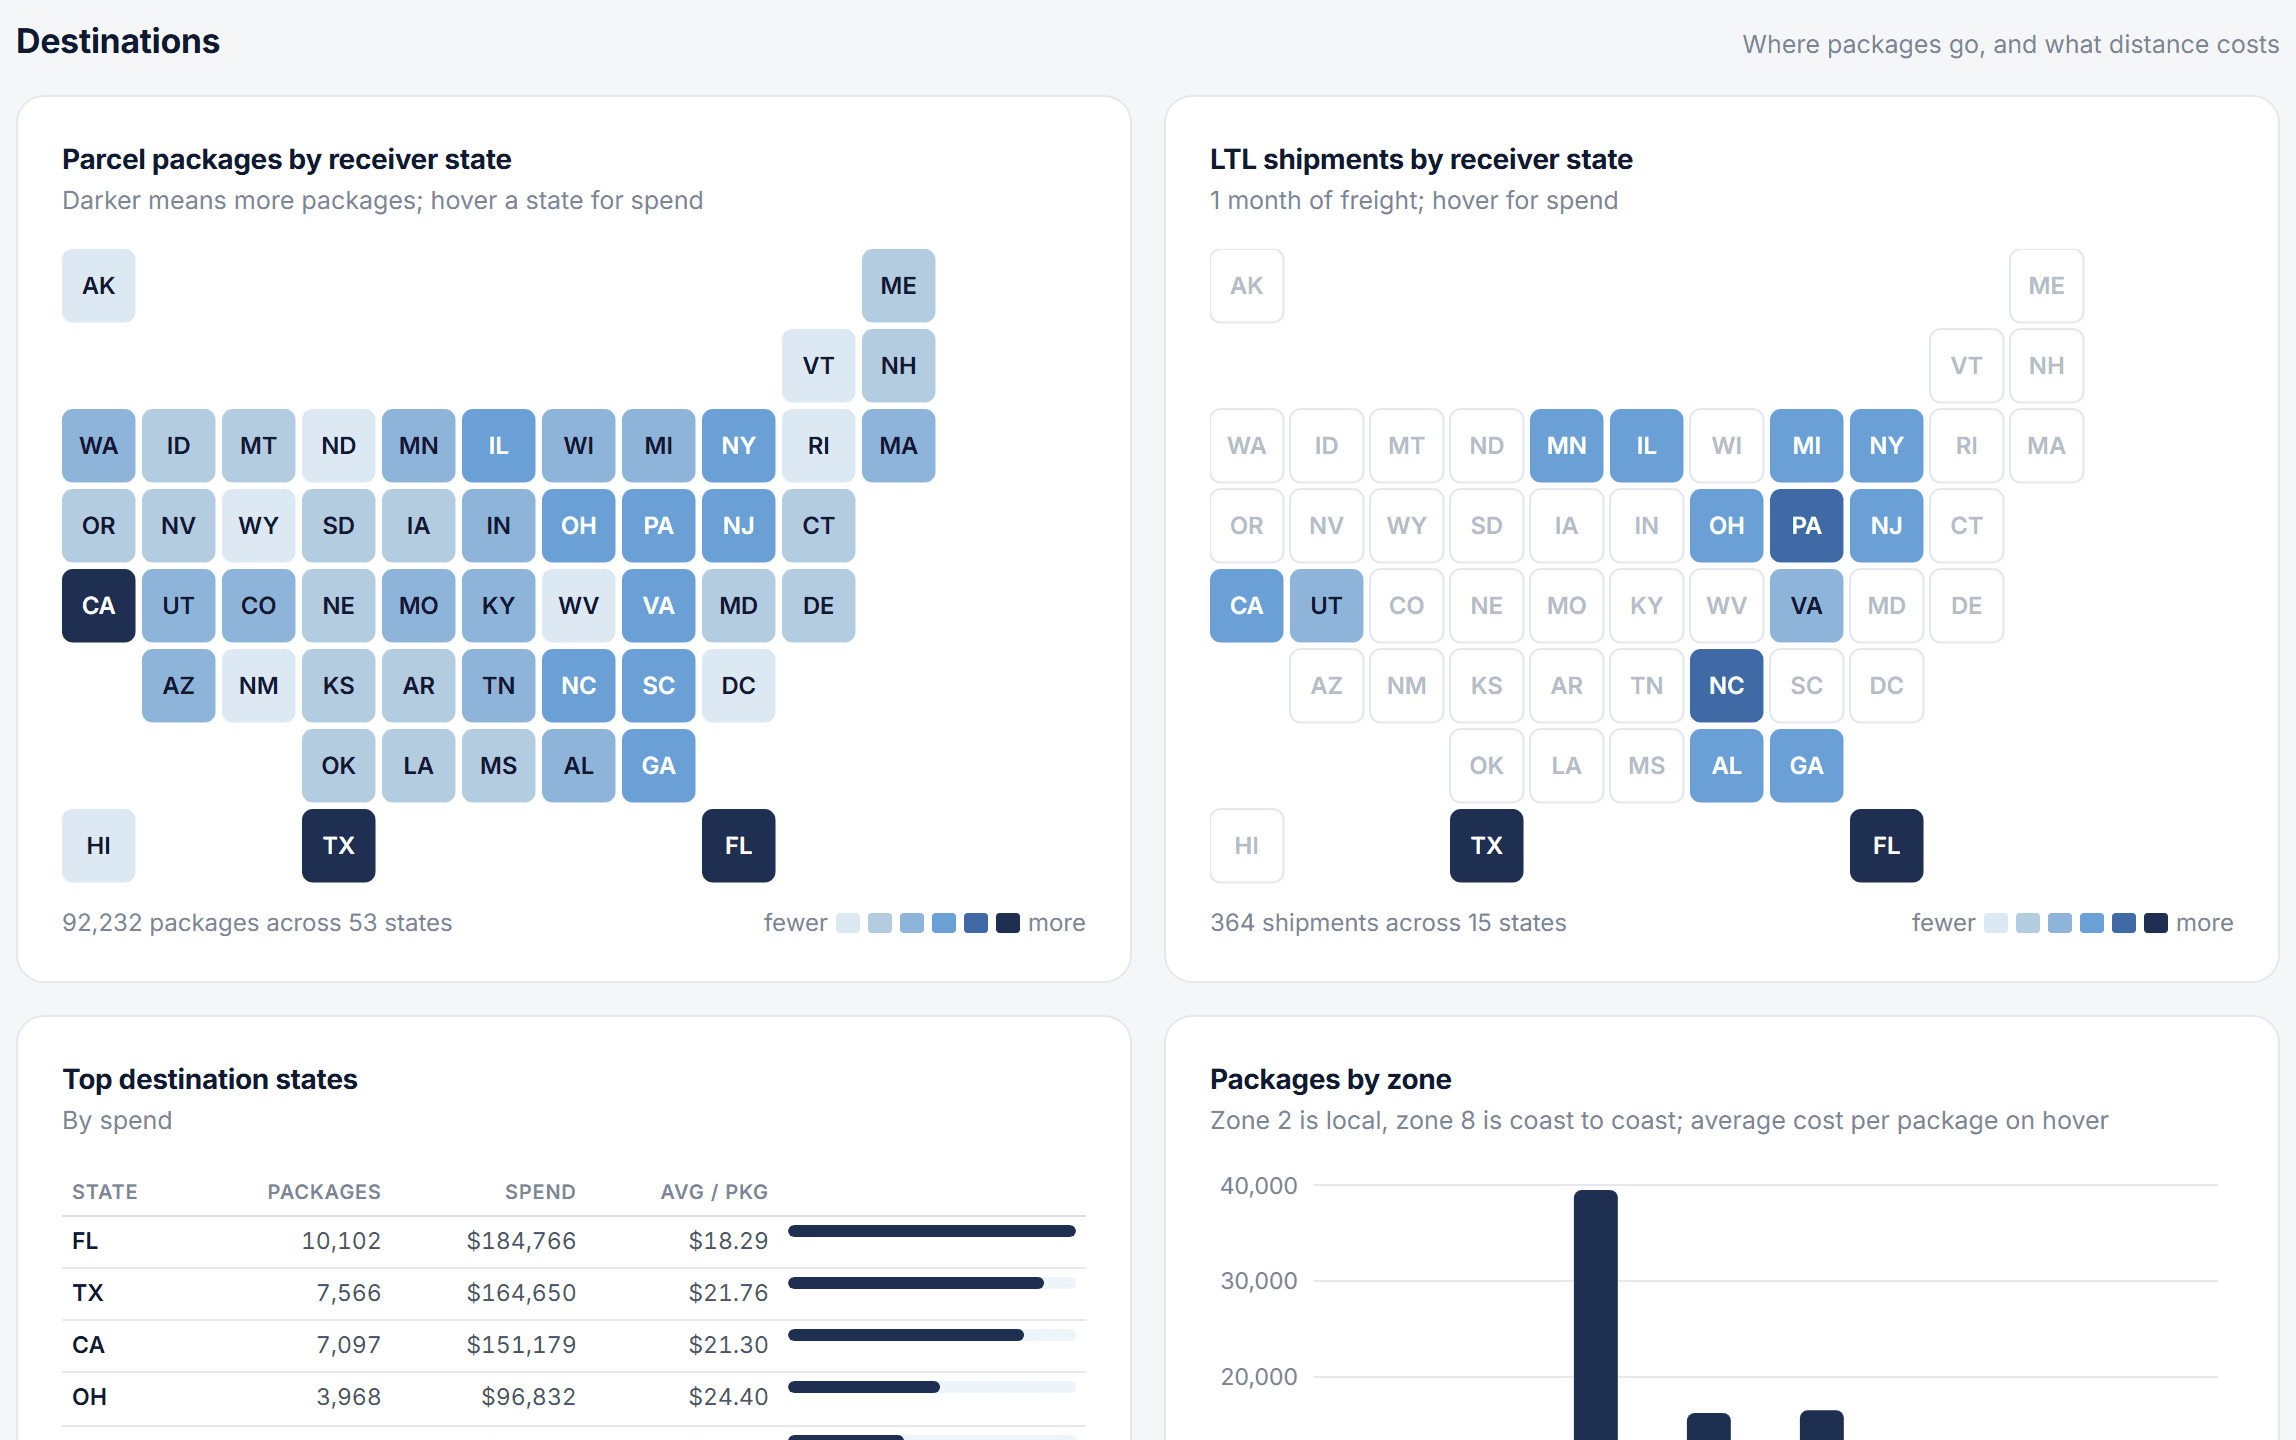
View parcel and LTL destinations by state, along with spend, package count and average cost by zone. Month-to-month comparisons help identify changes in shipping distance and cost.
- State tile maps that print and read at any size
- Average cost per package by zone, two through eight plus Alaska, Hawaii and international
- Destinations that repeatedly trigger delivery-area surcharges
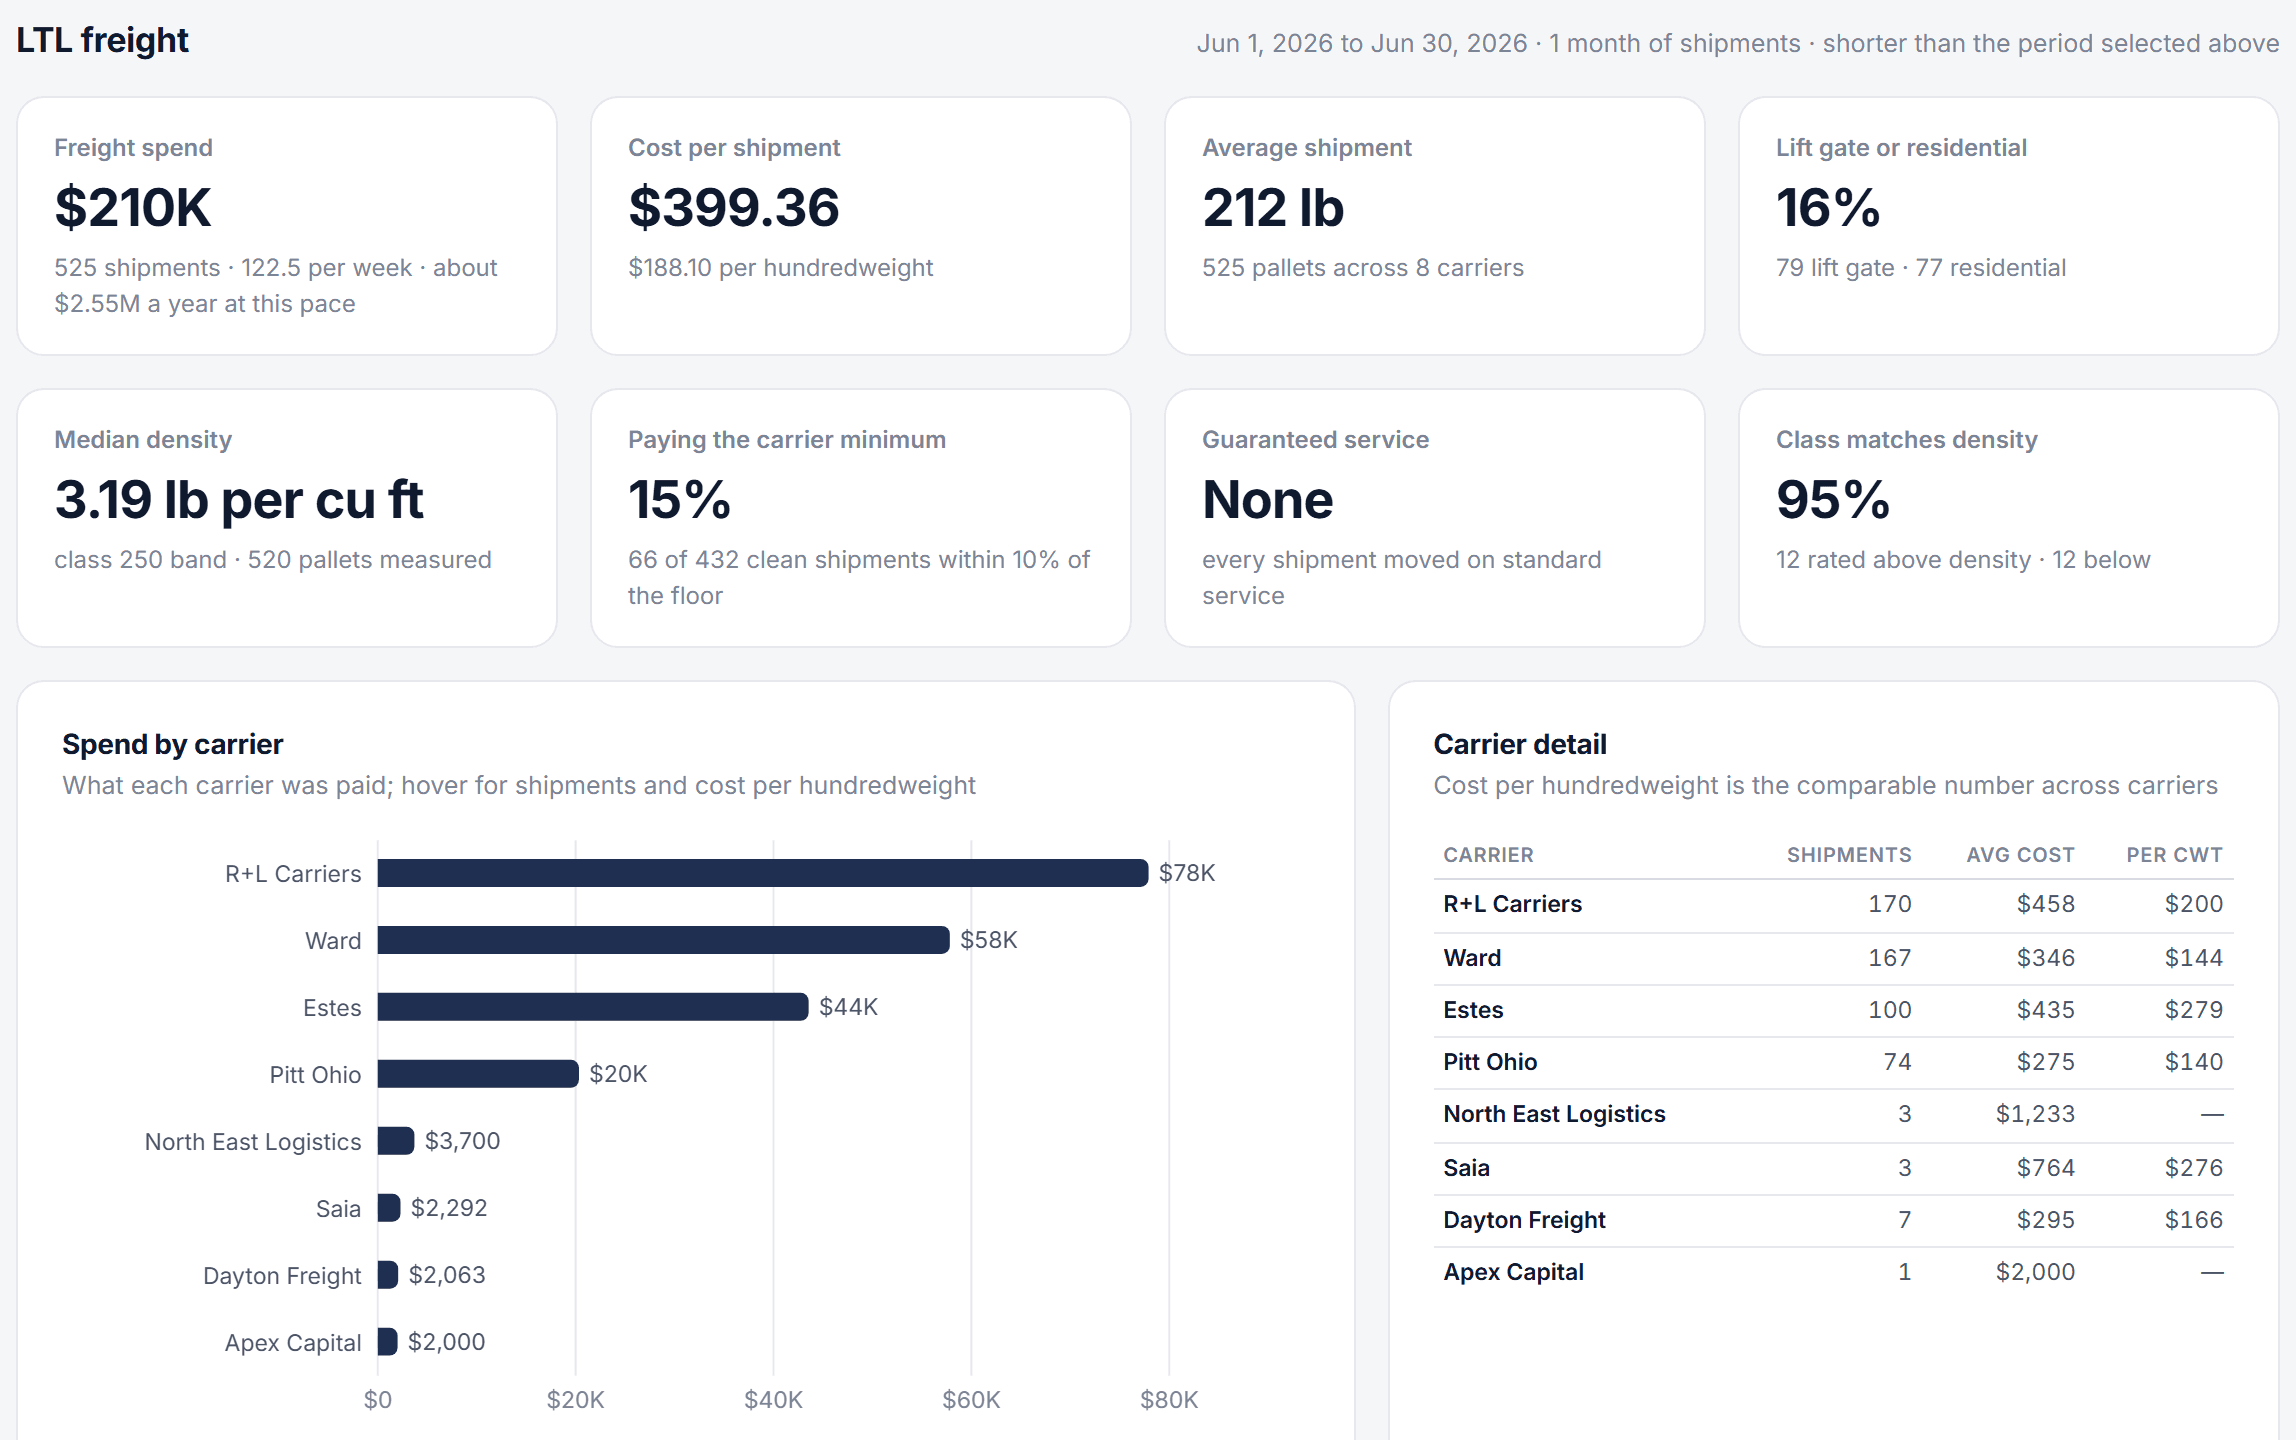
LTL freight analytics
Pallet freight in the same portal
Add a TMS shipment export to review LTL alongside parcel. See carrier spend, cost per hundredweight, expensive lanes, receivers, weights, freight classes and accessorials. Review density against NMFC classes and the shipments affected by carrier minimum charges.
- Carrier choice by destination state, priced at the carrier you already use there
- Class-250 pallets one packing change from class 175, priced at your own class-175 rates
- Residential and lift-gate premium implied against your own clean freight
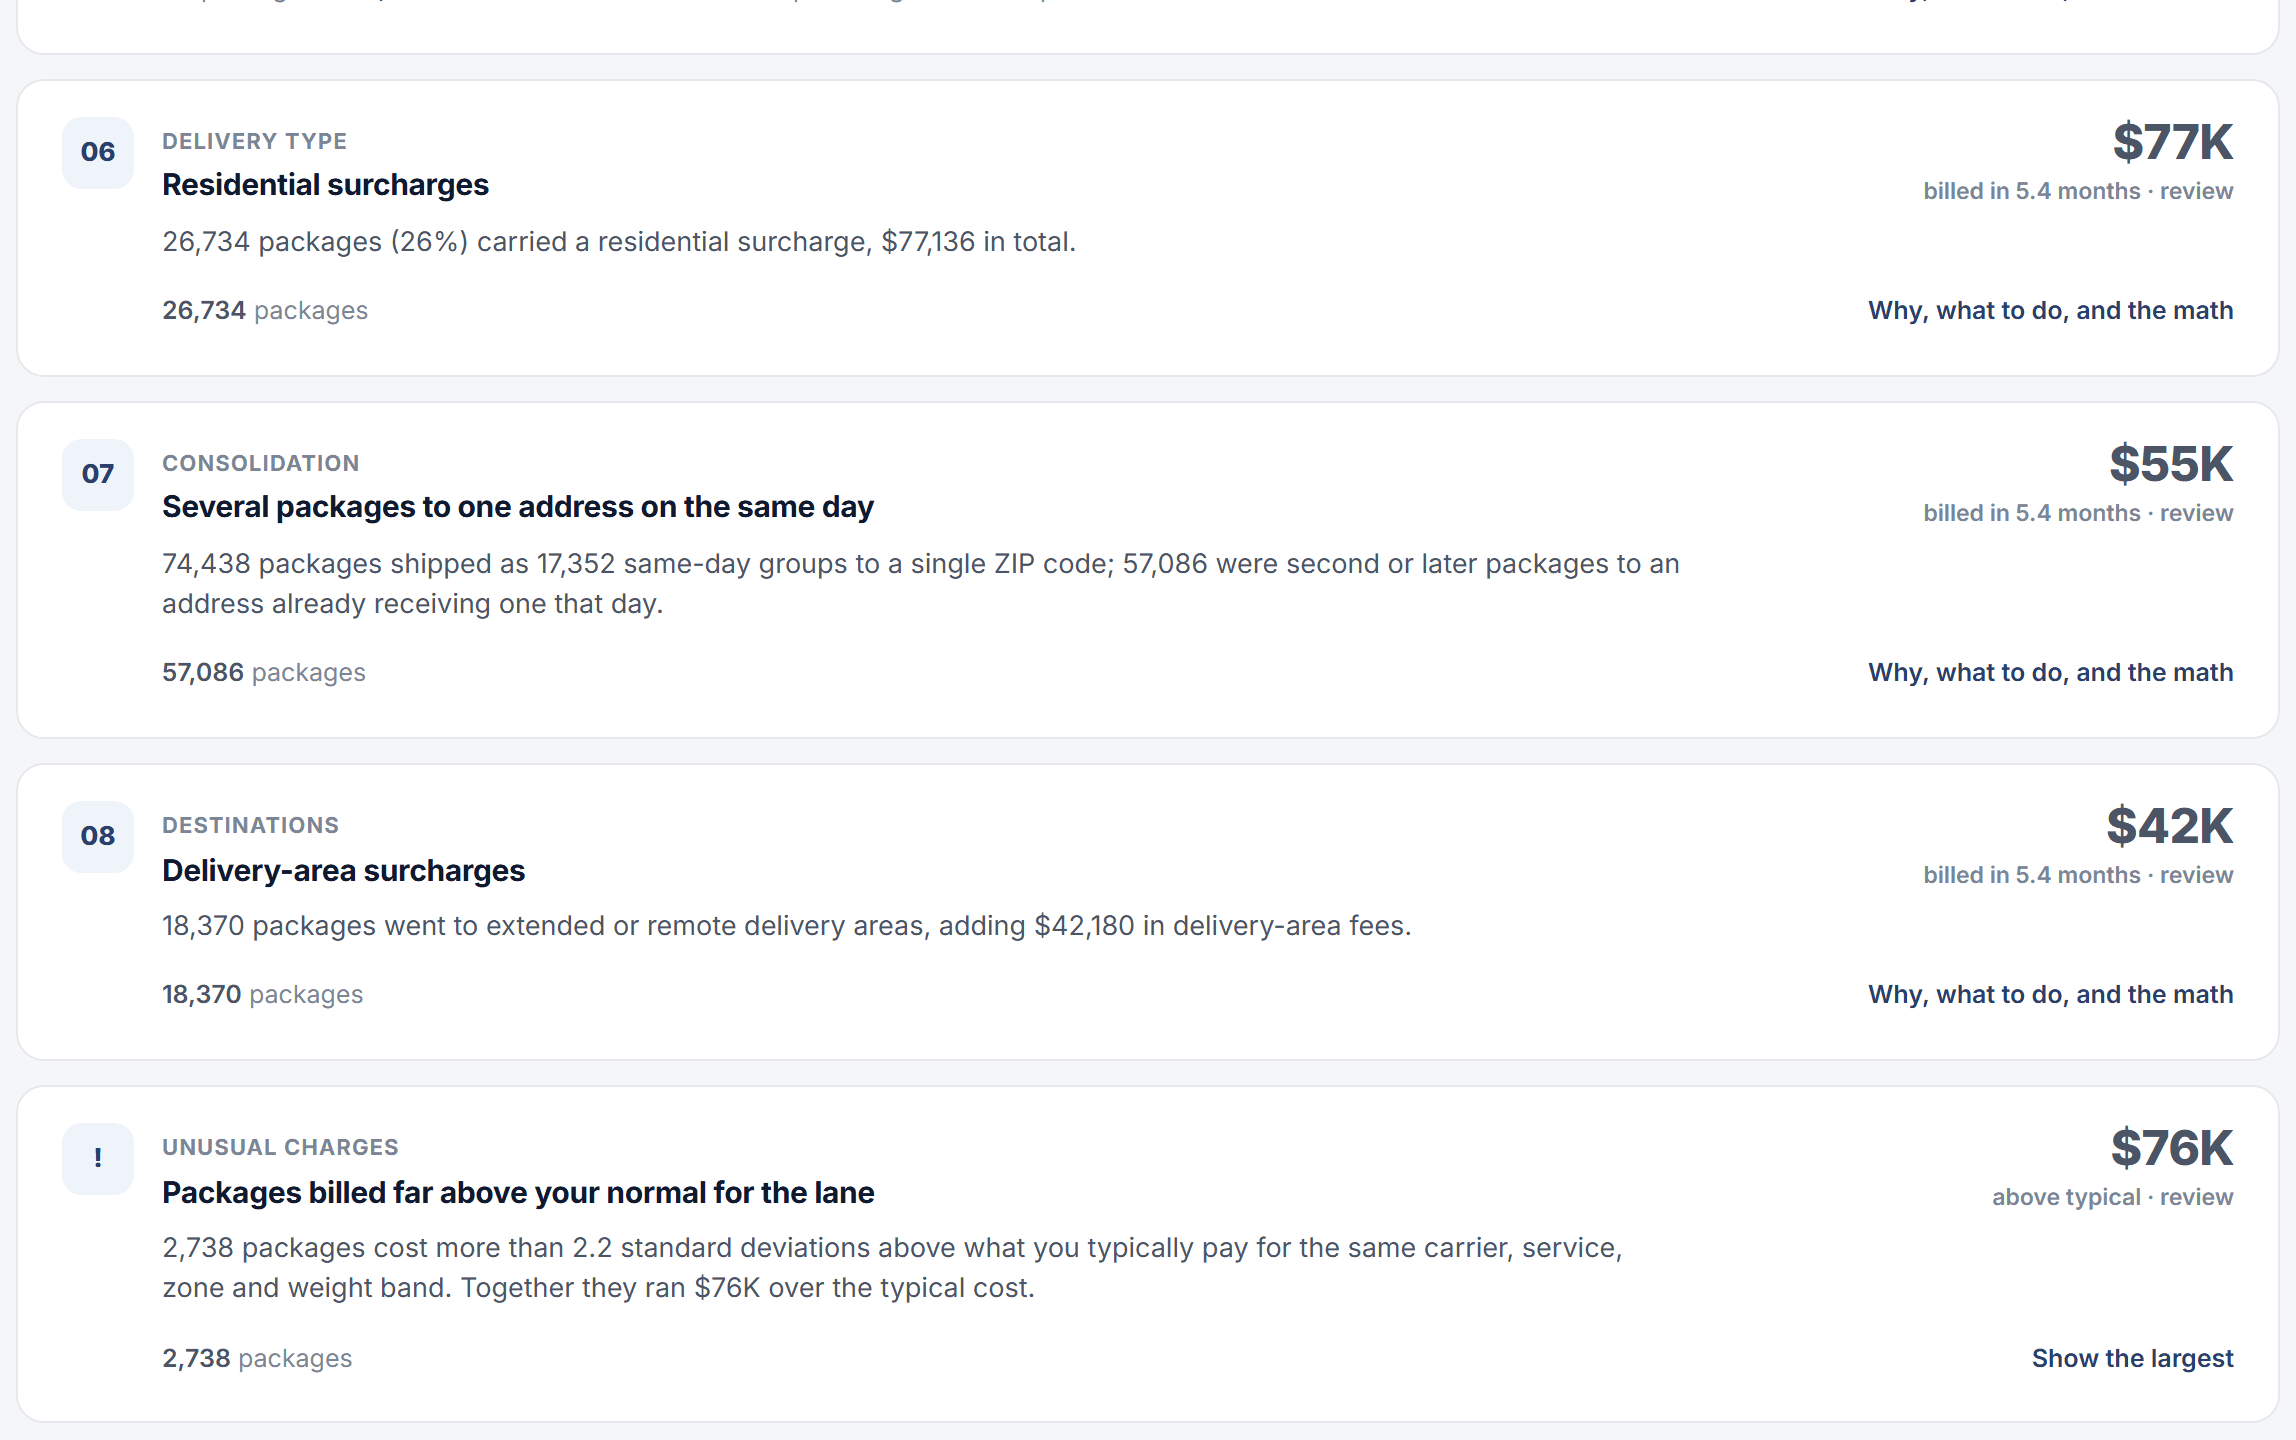
Shipping cost anomaly detection
Shipments with unusually high charges
Each package is compared with your typical cost for the same carrier, service, zone and weight band. Charges more than 2.2 standard deviations above that cost are flagged for review, with the individual charges shown.
- Comparisons use similar shipments to account for weight, zone, carrier and service
- Largest charges listed on each flagged package
- Exports to CSV with the rest of the plan
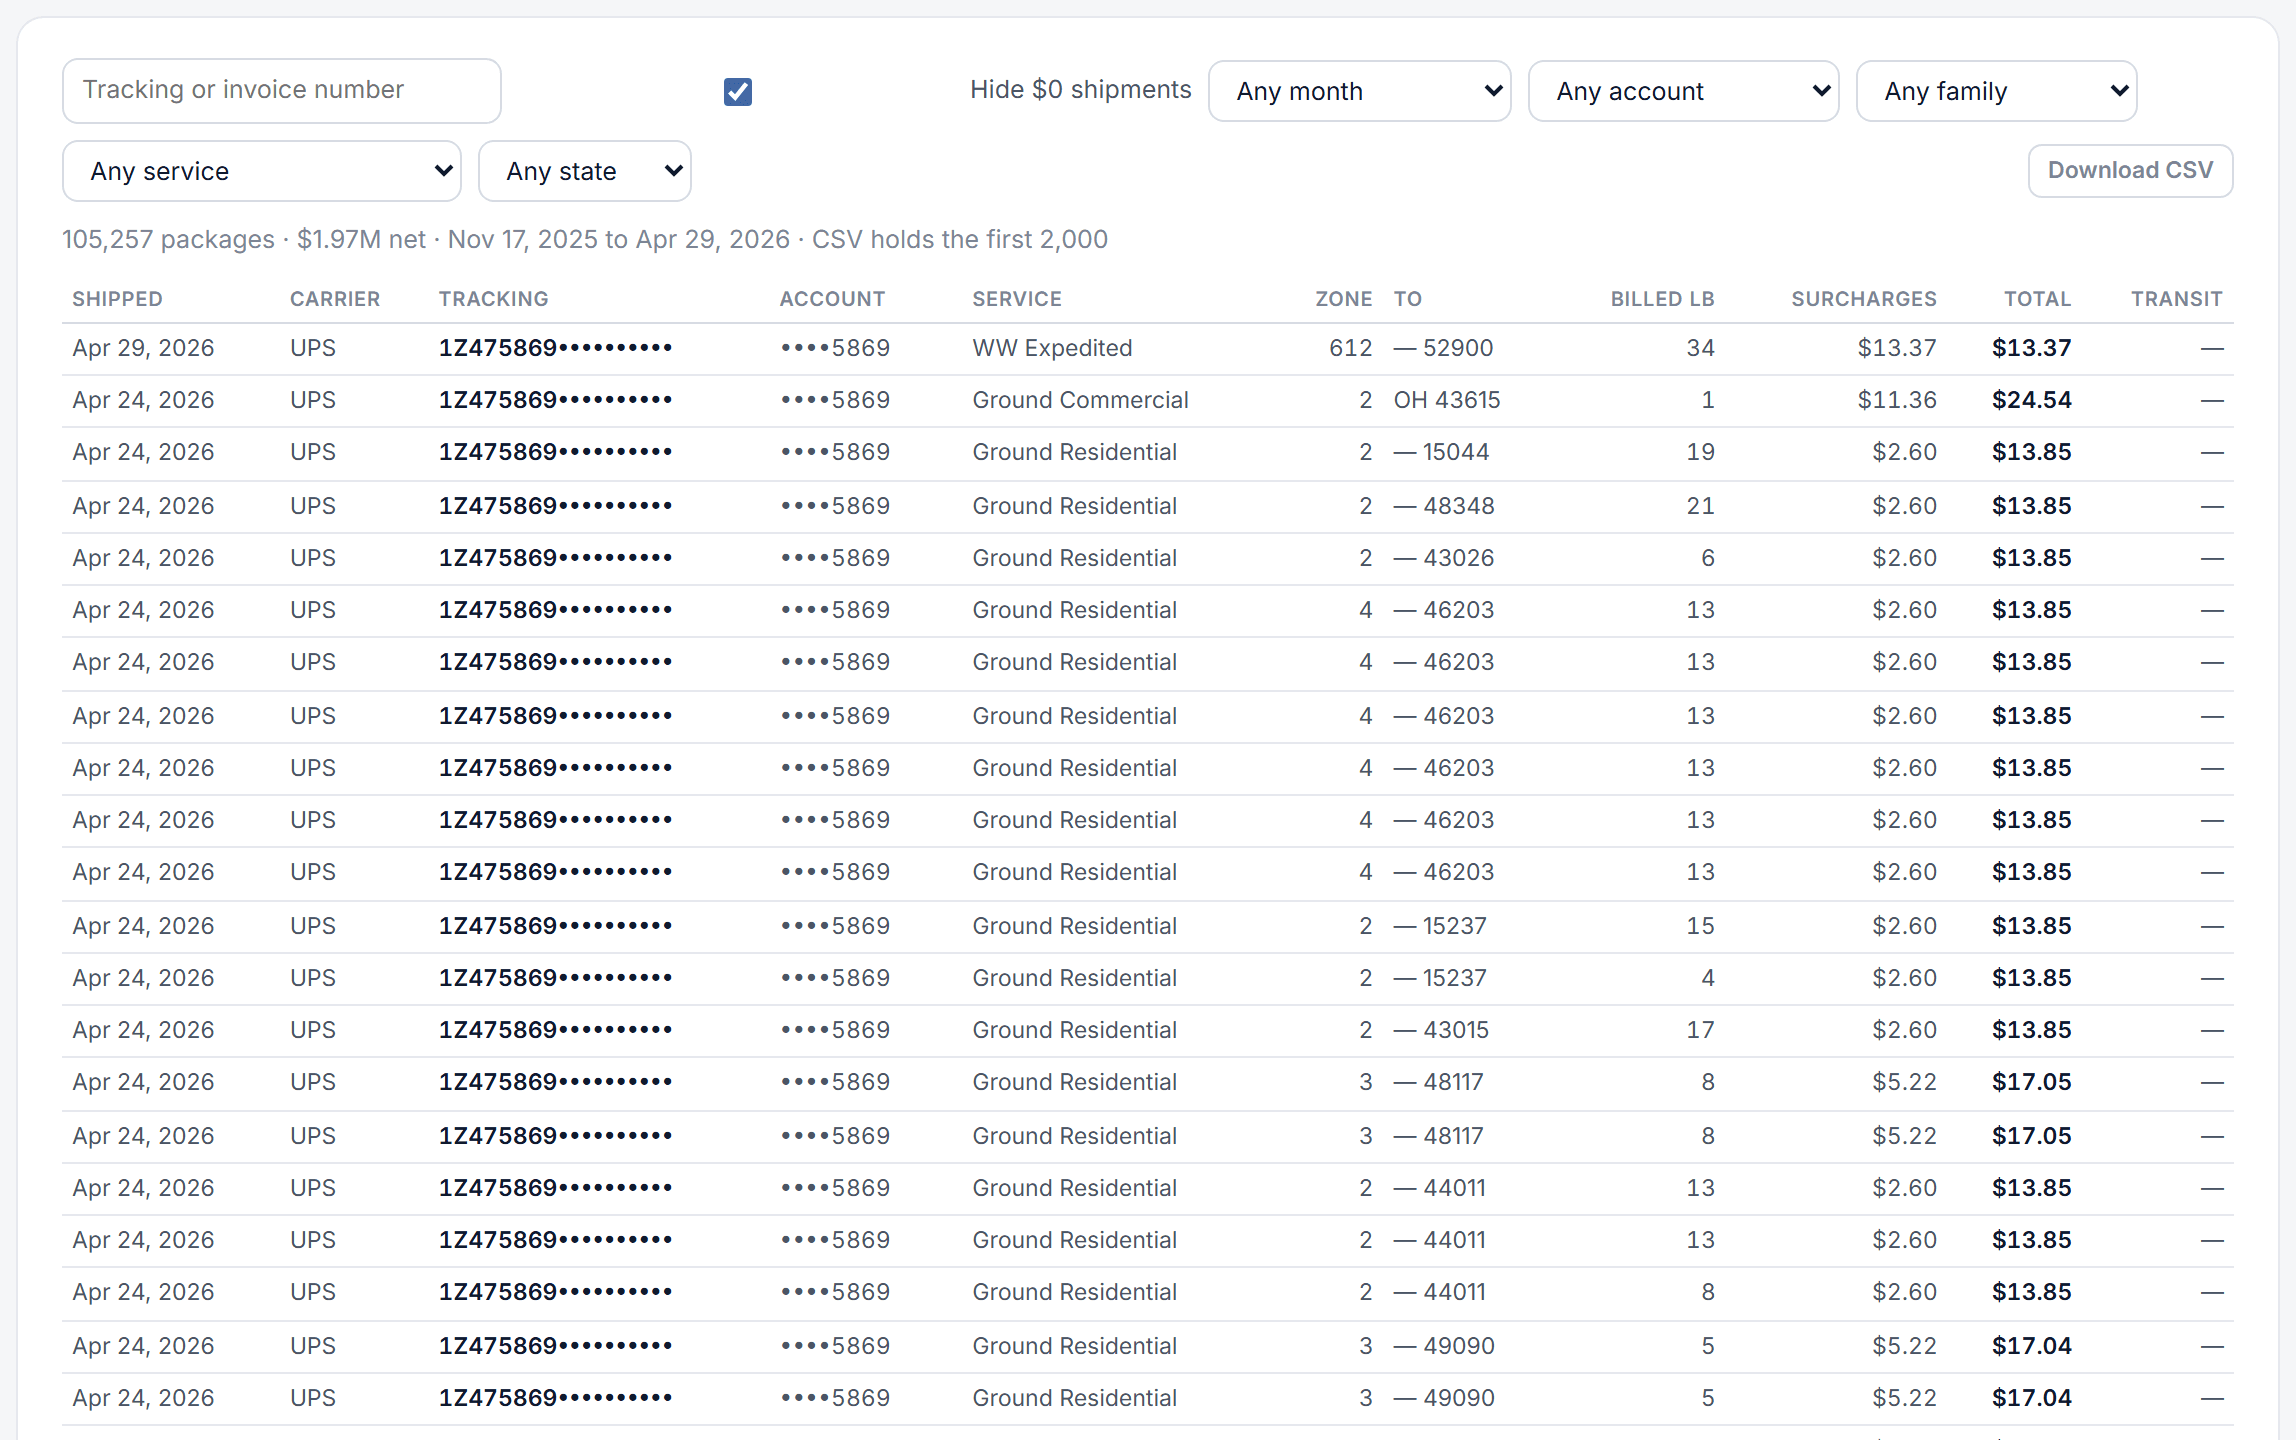
Shipment-level cost reporting
The package behind every number
Filter shipments by account, service, state, zone or month, or search by tracking or invoice number. Each row shows transportation, fuel, surcharges, total cost and transit. Open it for package dimensions, weight, delivery date and charge details. Export filtered results to CSV or print to PDF.
- Zero-dollar and third-party-billed packages hidden behind one checkbox
- CSV export of any filtered view, up to two thousand rows at a time
- Recent invoices with packages, surcharges and amount for reconciliation
A dashboard built around how you ship.
Every business ships differently. We customize your dashboard to fit your shipping processes, so your team can see the costs, performance measures and issues that matter to your operation. A retailer may need to track peak-season costs and dimensional weight, while a distributor may need a closer look at LTL freight class and reclassification charges.
Savings priced from your own shipments
We estimate savings using what you paid for comparable shipments with the same carrier, service, zone and weight. If there is not enough comparable data, we flag the opportunity without assigning a savings amount. Each estimate shows how many shipments it is based on.
Calculations you can review
Open a savings card to see the issue, recommended action, calculation and example packages. You can export the supporting shipments to CSV.
Honest about coverage
The portal shows the months of data available and the basis for annual estimates. Prior-period comparisons appear only when that period is fully covered. Missing fields, including delivery dates, are identified.
What the portal tracks.
Net invoiced by carrier, service and service family, with LTL freight beside parcel.
Fuel, residential, delivery area, handling and oversize, address correction, and the individual lines behind each.
Average net cost per package and per billed pound, trended by week or month.
Share of packages billed on box size, extra billed pounds, and the cartons responsible.
Distance band across the window, with cost per package for each zone.
Business days from ship to delivery, two-day share, and speed by zone and service.
For LTL, the effective floor each carrier charges and the share of freight paying it.
Pallet density against the NMFC scale, with billed-above and billed-below flags.
Packages more than 2.2 standard deviations above your typical cost for the same lane.
Alerts when shipping costs need attention.
Choose alerts by email, Slack, Microsoft Teams or webhook. We set thresholds for your account and check them as new billing data arrives, so changes reach your team during the billing cycle.
We track weekly revenue against discount thresholds and flag when you are approaching a tier change.
New surcharge and accessorial codes are flagged when they first appear in your billing data.
We compare costs with recent history by lane, zone and weight band to identify changes that monthly totals may hide.
We track the share billed by size rather than actual weight and identify the cartons involved.
We flag express shipments on routes where ground has met the same delivery requirement.
We track carrier reweighs and reclassifications by lane and carrier to identify records or packaging measurements that may need review.
We compare parcel and freight fuel charges with the applicable weekly index and the terms in your agreement.
Your team is notified when a shipment exceeds the cost threshold for comparable packages.
For clients using our audit service, we flag eligible claims approaching the carrier filing deadline.
How it runs.
Send the invoice files
Send detailed parcel carrier billing files and, for LTL, a TMS or broker shipment export. We can start with as little as one month of data. Twelve months gives us a fuller picture of seasonal changes and shipping patterns.
Day 1We normalize and load
We organize accounts, services, zones, weights, dimensions, surcharges and delivery dates in one format. We check duplicates, third-party billing and data coverage before preparing the reports.
Within a weekYour portal goes live
Each user gets a login. An ebb Logistics analyst walks you through the cost reports, savings recommendations and shipment details after the data is loaded.
Week 2Each invoice cycle updates it
New billing files update the reports and savings priorities. If you use our audit service, the portal also shows shipments checked, discrepancies flagged and credits identified.
Ongoing
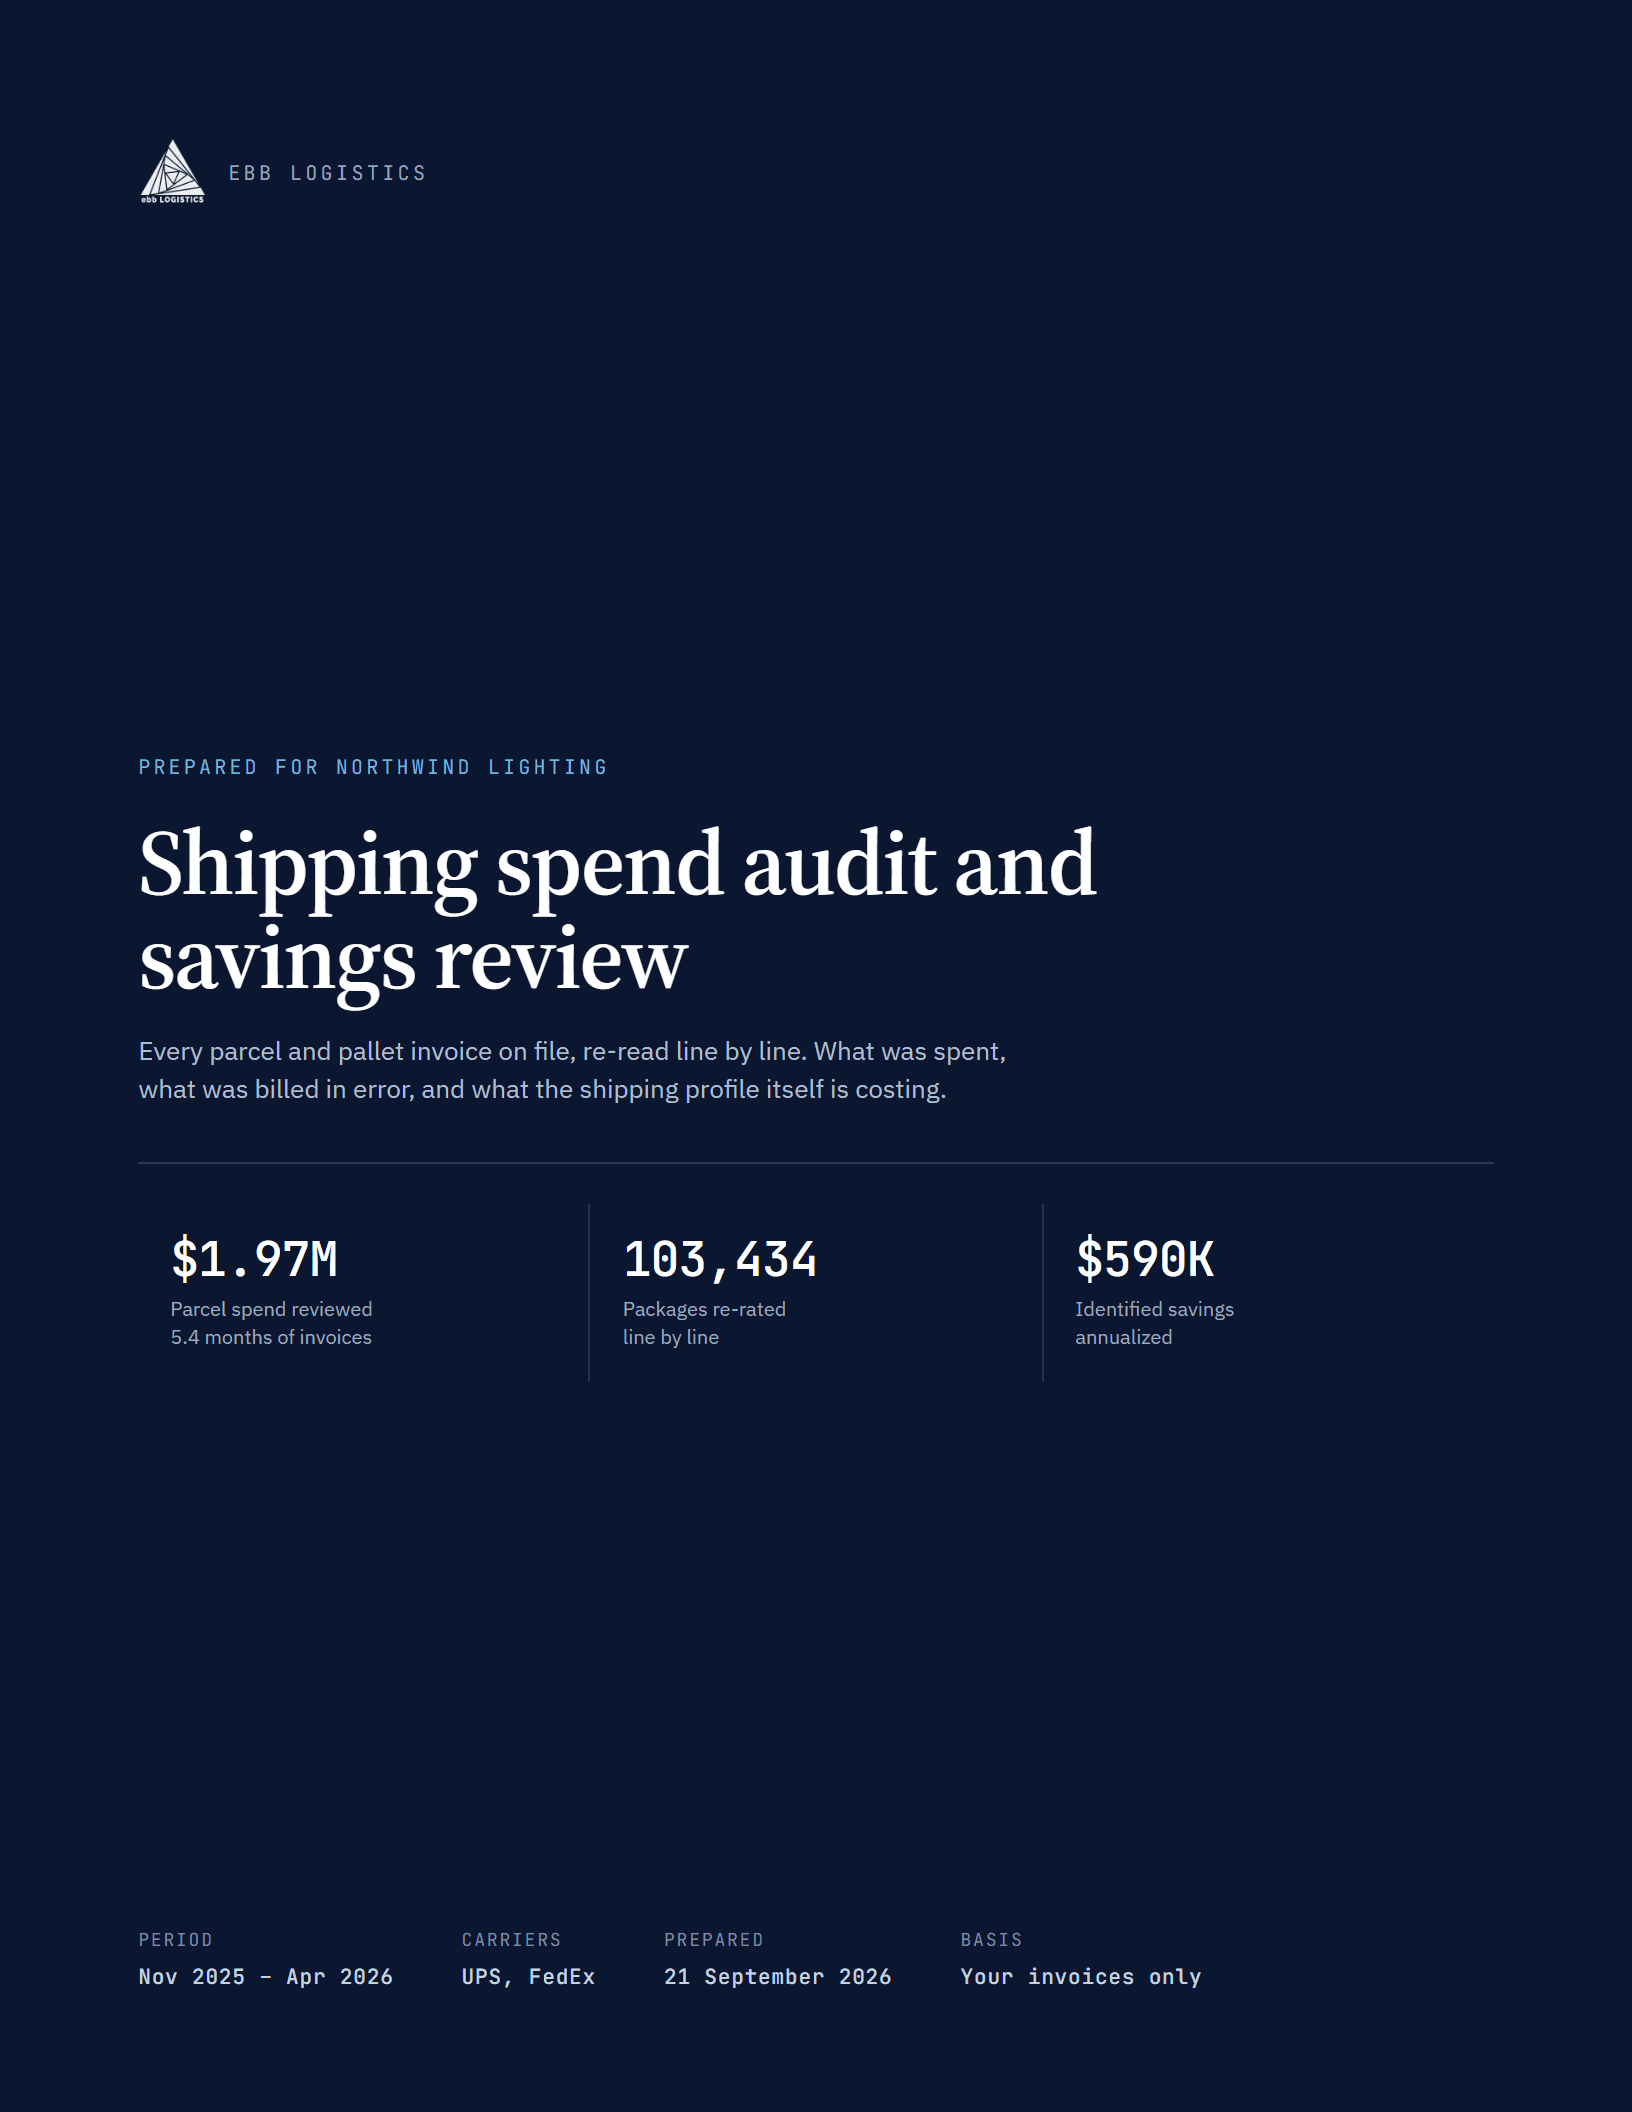
Export reports for your team.
Export the current view as a report for finance or management, then easily share it with your team through Slack, Microsoft Teams or email. The report includes your selected dates, carriers and findings, with the same figures shown in the portal.
Questions shippers ask about shipping analytics software.
What is parcel shipping analytics?
How is this different from the reports my carrier already gives me?
What shipping data does the platform analyze?
Which parcel carriers does the platform support?
Can I analyze UPS and FedEx data in one dashboard?
Can it integrate with our ERP or warehouse management system?
Can we get alerts when shipping costs change?
Can shipping analytics identify surcharges and billing anomalies?
What parcel shipping KPIs can I track?
How quickly can we start seeing insights?
How secure is our shipping and invoice data?
Can reports be customized for finance, operations and executive users?
What is the difference between parcel analytics and parcel audit?
How much does parcel shipping analytics software cost?
Request a quote for your business.
Tell us which carriers you use and your approximate monthly parcel volume. We will explain the setup and provide a quote. You can also contact us at info@ebblogic.com.